DataGuard Managed recovery hang

Our team deleted some archivelog by mistake. Rolled the database forwards by RMAN incremental recovery to an SCN. Did a manual recovery to sync it with the primary. Managed recovery is now failing.
alter database recover managed standby database disconnect

Alert log has :

Fri Jan 22 13:50:22 2010
Attempt to start background Managed Standby Recovery process
MRP0 started with pid=12
MRP0: Background Managed Standby Recovery process started
Media Recovery Waiting for thread 1 seq# 193389
Fetching gap sequence for thread 1, gap sequence 193389-193391
Trying FAL server: ITS
Fri Jan 22 13:50:28 2010
Completed: alter database recover managed standby database d
Fri Jan 22 13:53:25 2010
Failed to request gap sequence. Thread #: 1, gap sequence: 193389-193391
All FAL server has been attempted.

Managed recovery was working earlier today after the Rman incremental and resolved two gaps automatically. But it now appears hung with the standby falling behind the primary.

SQL> show parameter fal

NAME TYPE VALUE
------------------------------------ ----------- ------------------------------
fal_client string ITS_STBY
fal_server string ITS

[v08k608:ITS:oracle]$ tnsping ITS_STBY

TNS Ping Utility for Solaris: Version 9.2.0.7.0 - Production on 22-JAN-2010 15:01:17

Copyright (c) 1997 Oracle Corporation. All rights reserved.

Used parameter files:
/oracle/product/9.2.0/network/admin/sqlnet.ora


Used TNSNAMES adapter to resolve the alias
Attempting to contact (DESCRIPTION = (ADDRESS = (PROTOCOL= TCP)(Host= v08k608.am.mot.com)(Port= 1526)) (CONNECT_DATA = (SID = ITS)))
OK (10 msec)
[v08k608:ITS:oracle]$ tnsping ITS

TNS Ping Utility for Solaris: Version 9.2.0.7.0 - Production on 22-JAN-2010 15:01:27

Copyright (c) 1997 Oracle Corporation. All rights reserved.

Used parameter files:
/oracle/product/9.2.0/network/admin/sqlnet.ora


Used TNSNAMES adapter to resolve the alias
Attempting to contact (DESCRIPTION = (ADDRESS = (PROTOCOL= TCP)(Host= 187.10.68.75)(Port= 1526)) (CONNECT_DATA = (SID = ITS)))
OK (320 msec)

Primary has :
SQL> show parameter log_archive_dest_2
log_archive_dest_2 string SERVICE=DRITS_V08K608 reopen=6
0 max_failure=10 net_timeout=1
80 LGWR ASYNC=20480 OPTIONAL
NAME TYPE VALUE
------------------------------------ ----------- ------------------------------
log_archive_dest_state_2 string ENABLE
[ITS]/its15/oradata/ITS/arch> tnsping DRITS_V08K608
TNS Ping Utility for Solaris: Version 9.2.0.7.0 - Production on 22-JAN-2010 15:03:24
Copyright (c) 1997 Oracle Corporation. All rights reserved.
Used parameter files:
/oracle/product/9.2.0/network/admin/sqlnet.ora
Used TNSNAMES adapter to resolve the alias
Attempting to contact (DESCRIPTION = (ADDRESS = (PROTOCOL= TCP)(Host= 10.177.13.57)(Port= 1526)) (CONNECT_DATA = (SID = ITS)))
OK (330 msec)

The arch process on the primary database might hang due to a bug below so that it couldn’t ship the missing archive log
files to the standby database.

BUG 6113783 ARC PROCESSES CAN HANG INDEFINITELY ON NETWORK
[ Not published so not viewable in My Oracle Support ]
Fixed 11.2, 10.2.0.5 patchset

We could work workaround the issue by killing the arch processes on the primary site and they will be respawned
automatically immediately without harming the primary database.

[maclean@rh2 ~]$ ps -ef|grep arc
maclean   8231     1  0 22:24 ?        00:00:00 ora_arc0_PROD
maclean   8233     1  0 22:24 ?        00:00:00 ora_arc1_PROD
maclean   8350  8167  0 22:24 pts/0    00:00:00 grep arc
[maclean@rh2 ~]$ kill -9 8231 8233
[maclean@rh2 ~]$ ps -ef|grep arc
maclean   8389     1  0 22:25 ?        00:00:00 ora_arc0_PROD
maclean   8391     1  1 22:25 ?        00:00:00 ora_arc1_PROD
maclean   8393  8167  0 22:25 pts/0    00:00:00 grep arc

and alert log will have:

Fri Jul 30 22:25:27 EDT 2010
ARCH: Detected ARCH process failure
ARCH: STARTING ARCH PROCESSES
ARC0 started with pid=26, OS id=8389
Fri Jul 30 22:25:27 EDT 2010
ARC0: Archival started
ARC1: Archival started
ARCH: STARTING ARCH PROCESSES COMPLETE
ARC1 started with pid=27, OS id=8391
Fri Jul 30 22:25:27 EDT 2010
ARC0: Becoming the 'no FAL' ARCH
ARC0: Becoming the 'no SRL' ARCH
Fri Jul 30 22:25:27 EDT 2010
ARC1: Becoming the heartbeat ARCH

Actually if we don’t kill some fatal process in 10g , oracle will respawn all nonfatal processes.
For example:

[maclean@rh2 ~]$ ps -ef|grep ora_|grep -v grep
maclean  14264     1  0 23:16 ?        00:00:00 ora_pmon_PROD
maclean  14266     1  0 23:16 ?        00:00:00 ora_psp0_PROD
maclean  14268     1  0 23:16 ?        00:00:00 ora_mman_PROD
maclean  14270     1  0 23:16 ?        00:00:00 ora_dbw0_PROD
maclean  14272     1  0 23:16 ?        00:00:00 ora_lgwr_PROD
maclean  14274     1  0 23:16 ?        00:00:00 ora_ckpt_PROD
maclean  14276     1  0 23:16 ?        00:00:00 ora_smon_PROD
maclean  14278     1  0 23:16 ?        00:00:00 ora_reco_PROD
maclean  14338     1  0 23:16 ?        00:00:00 ora_arc0_PROD
maclean  14340     1  0 23:16 ?        00:00:00 ora_arc1_PROD
maclean  14452     1  0 23:17 ?        00:00:00 ora_s000_PROD
maclean  14454     1  0 23:17 ?        00:00:00 ora_d000_PROD
maclean  14456     1  0 23:17 ?        00:00:00 ora_cjq0_PROD
maclean  14458     1  0 23:17 ?        00:00:00 ora_qmnc_PROD
maclean  14460     1  0 23:17 ?        00:00:00 ora_mmon_PROD
maclean  14462     1  0 23:17 ?        00:00:00 ora_mmnl_PROD
maclean  14467     1  0 23:17 ?        00:00:00 ora_q000_PROD
maclean  14568     1  0 23:18 ?        00:00:00 ora_q001_PROD

[maclean@rh2 ~]$ ps -ef|grep ora_|grep -v pmon|grep -v ckpt |grep -v lgwr|grep -v smon|grep -v grep|grep -v dbw|grep -v psp|grep -v mman |grep -v rec|awk '{print $2}'|xargs kill -9

and alert log will have:
Fri Jul 30 23:20:58 EDT 2010
ARCH: Detected ARCH process failure
ARCH: STARTING ARCH PROCESSES
ARC0 started with pid=20, OS id=14959
Fri Jul 30 23:20:58 EDT 2010
ARC0: Archival started
ARC1: Archival started
ARCH: STARTING ARCH PROCESSES COMPLETE
Fri Jul 30 23:20:58 EDT 2010
ARC0: Becoming the 'no FAL' ARCH
ARC0: Becoming the 'no SRL' ARCH
ARC1 started with pid=21, OS id=14961
ARC1: Becoming the heartbeat ARCH
Fri Jul 30 23:21:29 EDT 2010
found dead shared server 'S000', pid = (10, 3)
found dead dispatcher 'D000', pid = (11, 3)
Fri Jul 30 23:22:29 EDT 2010
Restarting dead background process CJQ0
Restarting dead background process QMNC
CJQ0 started with pid=12, OS id=15124
Fri Jul 30 23:22:29 EDT 2010
Restarting dead background process MMON
QMNC started with pid=13, OS id=15126
Fri Jul 30 23:22:29 EDT 2010
Restarting dead background process MMNL
MMON started with pid=14, OS id=15128
MMNL started with pid=16, OS id=15132

That's all right!
利用Toad for Data Analysts软件生成查询语句

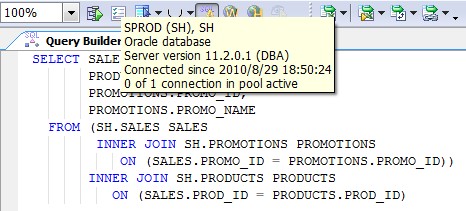
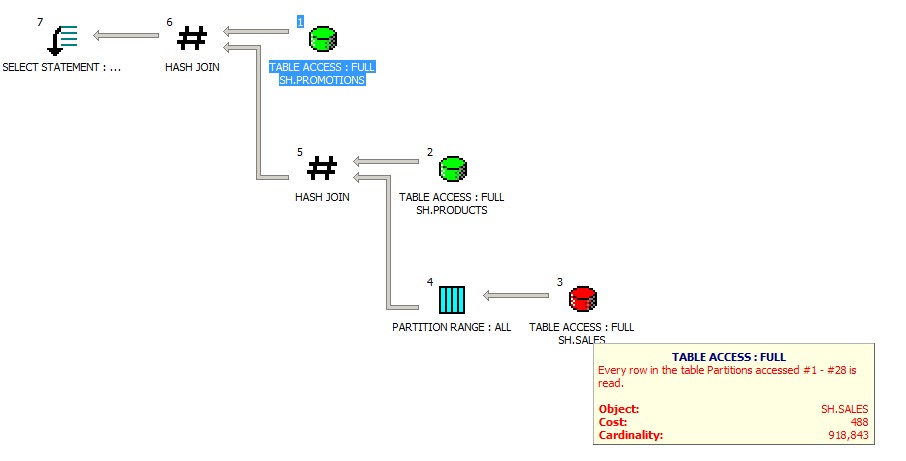
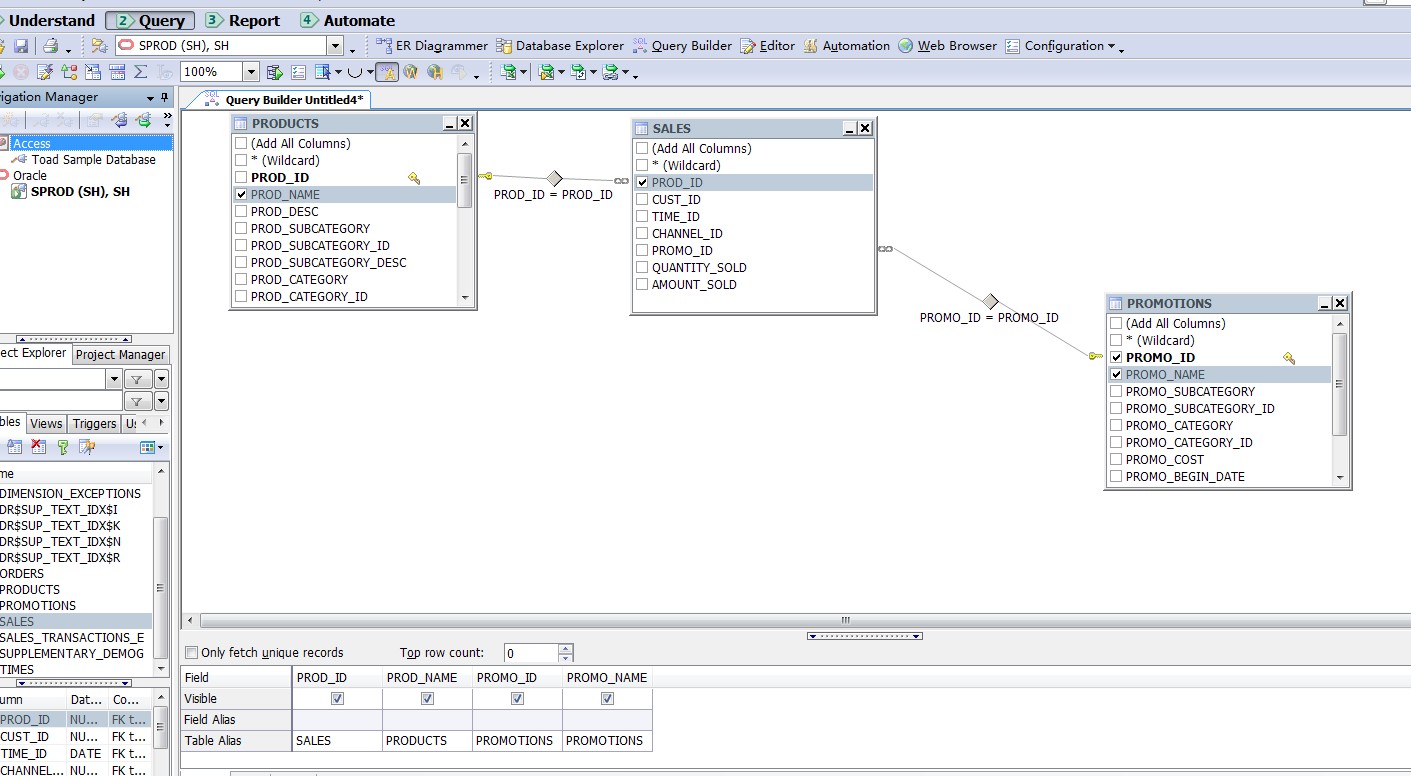
下午尝试用Toad For Data Analysts生成查询语句和ER模型图,感觉还不错;同时配有图形化的执行计划示意图,配合Toad的SQL optimizer可以算是一个很不错的数据库开发组合。

生成查询的Query Builder界面:

生成的SQL语句:

图形化的执行计划:

重做日志浪费(redo wastage)

Oracle中联机日志文件(online redo log)在大多平台上以512 字节为一个标准块。

(HPUX,Tru64 Unix上是1024bytes,SCO UNIX,Reliant UNIX上是2048bytes,而MVS,MPE/ix上是4096bytes,虽然以上许多UNIX已经不再流行,实际情况可以通过

select max(l.lebsz) log_block_size_kccle

from sys.x$kccle l

where l.inst_id = userenv(‘Instance’)   语句查询到)

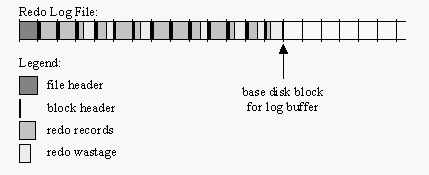
LGWR后台进程写出REDO时未必能填满最后的当前日志块。举例而言,假设redo buffer中有1025字节的内容需要写出,则1025=512+512+1 共占用三个重做日志标准块,前2个标准块被填满而第三个标准块只使用了1个字节。在LGWR完成写出前,需要释放”redo allocation”闩,在此之前SGA中索引”redo buffer”信息的变量将指向未被填满块后面的一个重做块,换而言之有511字节的空间被LGWR跳过了,这就是我们说的redo wastage;我们可以通过分析v$sysstat动态视图中的redo wastage统计信息了解实例生命周期中的重做浪费量。

SQL> col name for a25
SQL> select name,value from v$sysstat where name like '%wastage%';

NAME                           VALUE
------------------------- ----------
redo wastage                  132032

redo wastage的一个图示:

为什么要浪费这部分空间呢?实际上,这种做法十分有益于LGWR的串行I/O模式。redo wastage并不是问题或者Bug,而是Oracle故意为之的。当然过量的redo wastage也不是什么好事,一般是LGWR写出过于频繁的症状表现。9i以后很少有因为隐式参数_log_io_size过小而导致的LGWR过载了,如果在您的系统中发现redo wastage的问题不小,那么无限制地滥用commit操作往往是引起问题的罪魁祸首,减少不必要的commit语句,把commit从循环中移除都将利于减少redo wastage。

我们来看一下关于redo wastage的演示:

SQL> select distinct bytes/1024/1024 from v$log;

BYTES/1024/1024
---------------
             50                          /*确认联机日志文件大小为50MB*/
SQL> archive log list;                 /*确认数据库处于归档状态*/
Database log mode              Archive Mode
Automatic archival             Enabled
Archive destination            /s01/arch
SQL> set time on;
19:49:45 SQL> alter system switch logfile;           /*切换日志,清理现场*/
System altered.
19:51:07 SQL> col name for a25
19:51:16 SQL> select name,value from v$sysstat where name in ('redo size','redo wastage');

NAME                           VALUE
------------------------- ----------
redo size                 1418793324
redo wastage                88286544               /*演示开始时的基础统计值*/
19:51:19 SQL> begin
19:52:10   2  for i in 1..550000 loop
19:52:10   3  insert into tv values(1,'a');
19:52:10   4   commit;
19:52:10   5   end loop;
19:52:10   6   end;
19:52:11   7  /
/*匿名块中commit操作位于loop循环内,将导致大量redo wastage*/
PL/SQL procedure successfully completed.

19:53:07 SQL> select name,value from v$sysstat where name in ('redo size','redo wastage');

NAME                           VALUE
------------------------- ----------
redo size                 1689225404
redo wastage               112011352
/*频繁提交的匿名块产生了 1689225404-1418793324=257MB的redo,其中存在112011352-88286544=22MB的redo wastage*/

19:53:14 SQL>  begin
19:53:33   2  for i in 1..550000 loop
19:53:33   3  insert into tv values(1,'a');
19:53:33   4  end loop;
19:53:33   5    commit;
19:53:33   6   end;
19:53:34   7  /
/* 此匿名块中commit操作被移除loop循环中,批量修改数据后仅在最后提交一次*/
PL/SQL procedure successfully completed.

19:53:59 SQL> select name,value from v$sysstat where name in ('redo size','redo wastage');

NAME                           VALUE
------------------------- ----------
redo size                 1828546240
redo wastage               112061296
/*稀疏提交的匿名块最后产生了1828546240-1689225404=132MB的重做,而redo wastage为112061296-112011352=48k*/

可能您会很奇怪前者不是只比后者多出22MB的redo浪费吗,为什么总的redo量差了那么多?

我们需要注意到commit本身也是要产生redo的,而且其所产生的还不少!就以上演示来看频繁提交的过程中,commit所占用的redo空间几乎接近一半(257-132-22)/257=40%,而每次commit的平均redo量为(257-132-22)*1024*1024/550000=196 bytes。

commit操作是事务ACID的基础之一,合理运用commit可以帮我们构建健壮可靠的应用,而滥用它必将是另一场灾难!

latch free:cache buffer handles造成的SQL性能问题

数月之前,一位新疆的同事反映客户的某套单节点数据库存在性能问题,某个SQL长时间运行没有结束,在该SQL运行期间大量回话处于latch free等待中。因为相隔遥遥千里,同事之间是通过Email交流的;他首先给我发来了该问题SQL的相关explain_log。其中该语句的执行计划如下:

-----------------------------------------------------------------------------------------------
| Id  | Operation                               |  Name               | Rows  | Bytes | Cost  |
-----------------------------------------------------------------------------------------------
|   0 | SELECT STATEMENT                        |                     |     1 |  1956 |    13 |
|*  1 |  FILTER                                 |                     |       |       |       |
|   2 |   NESTED LOOPS OUTER                    |                     |     1 |  1956 |    13 |
|   3 |    NESTED LOOPS OUTER                   |                     |     1 |  1942 |    12 |
|   4 |     NESTED LOOPS OUTER                  |                     |     1 |  1924 |    11 |
|   5 |      NESTED LOOPS                       |                     |     1 |  1906 |    10 |
|   6 |       NESTED LOOPS                      |                     |     1 |  1856 |     9 |
|   7 |        NESTED LOOPS                     |                     |     5 |  9055 |     8 |
|   8 |         NESTED LOOPS OUTER              |                     |     5 |  8575 |     7 |
|   9 |          NESTED LOOPS OUTER             |                     |     5 |  8280 |     6 |
|  10 |           NESTED LOOPS OUTER            |                     |     5 |  7785 |     5 |
|  11 |            NESTED LOOPS OUTER           |                     |     5 |  7290 |     4 |
|  12 |             NESTED LOOPS OUTER          |                     |     5 |  4130 |     3 |
|* 13 |              TABLE ACCESS BY INDEX ROWID| S_PROD_INT          |     5 |  2960 |     2 |
|* 14 |               INDEX RANGE SCAN          | S_PROD_INT_M53      |   326 |       |     5 |
|  15 |              TABLE ACCESS BY INDEX ROWID| S_PROD_LN           |     1 |   234 |     1 |
|* 16 |               INDEX UNIQUE SCAN         | S_PROD_LN_P1        |     1 |       |       |
|  17 |             TABLE ACCESS BY INDEX ROWID | S_PROD_INT_CRSE     |     1 |   632 |     1 |
|* 18 |              INDEX RANGE SCAN           | S_PROD_INT_CRSE_U1  |     1 |       |     1 |
|  19 |            TABLE ACCESS BY INDEX ROWID  | S_LIT               |     1 |    99 |     1 |
|* 20 |             INDEX UNIQUE SCAN           | S_LIT_P1            |     1 |       |       |
|  21 |           TABLE ACCESS BY INDEX ROWID   | S_LIT               |     1 |    99 |     1 |
|* 22 |            INDEX UNIQUE SCAN            | S_LIT_P1            |     1 |       |       |
|  23 |          TABLE ACCESS BY INDEX ROWID    | S_PROD_INT_TNTX     |     1 |    59 |     1 |
|* 24 |           INDEX RANGE SCAN              | S_PROD_INT_TNTX_U1  |     1 |       |     1 |
|  25 |         TABLE ACCESS BY INDEX ROWID     | S_VOD               |     1 |    96 |     1 |
|* 26 |          INDEX RANGE SCAN               | S_VOD_U2            |     1 |       |     2 |
|* 27 |        TABLE ACCESS BY INDEX ROWID      | S_VOD_VER           |     1 |    45 |     1 |
|* 28 |         INDEX RANGE SCAN                | S_VOD_VER_U1        |     2 |       |     4 |
|  29 |       TABLE ACCESS BY INDEX ROWID       | S_ISS_OBJ_DEF       |     1 |    50 |     1 |
|* 30 |        INDEX RANGE SCAN                 | S_ISS_OBJ_DEF_M3    |     1 |       |     2 |
|  31 |      TABLE ACCESS BY INDEX ROWID        | S_CTLG_CAT          |     1 |    18 |     1 |
|* 32 |       INDEX UNIQUE SCAN                 | S_CTLG_CAT_P1       |     1 |       |       |
|  33 |     TABLE ACCESS BY INDEX ROWID         | S_CTLG_CAT          |     1 |    18 |     1 |
|* 34 |      INDEX UNIQUE SCAN                  | S_CTLG_CAT_P1       |     1 |       |       |
|  35 |    TABLE ACCESS BY INDEX ROWID          | S_CTLG_CAT          |     1 |    14 |     1 |
|* 36 |     INDEX UNIQUE SCAN                   | S_CTLG_CAT_P1       |     1 |       |       |
|  37 |   NESTED LOOPS                          |                     |     1 |   137 |     7 |
|  38 |    NESTED LOOPS                         |                     |     4 |   456 |     6 |
|  39 |     NESTED LOOPS                        |                     |     4 |   364 |     5 |
|  40 |      NESTED LOOPS                       |                     |     2 |   142 |     4 |
|  41 |       NESTED LOOPS                      |                     |     1 |    53 |     3 |
|  42 |        NESTED LOOPS                     |                     |     3 |   120 |     2 |
|* 43 |         INDEX RANGE SCAN                | S_CTLG_CAT_PROD_U1  |     3 |    57 |     2 |
|* 44 |         TABLE ACCESS BY INDEX ROWID     | S_CTLG_CAT          |     1 |    21 |     1 |
|* 45 |          INDEX UNIQUE SCAN              | S_CTLG_CAT_P1       |     1 |       |       |
|* 46 |        TABLE ACCESS BY INDEX ROWID      | S_CTLG              |     1 |    13 |     1 |
|* 47 |         INDEX UNIQUE SCAN               | S_CTLG_P1           |     1 |       |       |
|  48 |       TABLE ACCESS BY INDEX ROWID       | S_PARTY_CTGRY       |     2 |    36 |     1 |
|* 49 |        INDEX RANGE SCAN                 | S_PARTY_CTGRY_F1    |     2 |       |     1 |
|  50 |      TABLE ACCESS BY INDEX ROWID        | S_PARTY_RPT_REL     |     2 |    40 |     1 |
|* 51 |       INDEX RANGE SCAN                  | S_PARTY_RPTREL_F50  |     2 |       |     1 |
|  52 |     TABLE ACCESS BY INDEX ROWID         | S_PARTY_PER         |     1 |    23 |     1 |
|* 53 |      INDEX RANGE SCAN                   | S_PARTY_PER_F1      |     1 |       |     2 |
|* 54 |    INDEX RANGE SCAN                     | S_PARTY_PER_U1      |     1 |    23 |     3 |
|  55 |   NESTED LOOPS                          |                     |     1 |   157 |     8 |
|  56 |    NESTED LOOPS                         |                     |     1 |   144 |     7 |
|  57 |     NESTED LOOPS                        |                     |     1 |   125 |     6 |
|  58 |      NESTED LOOPS                       |                     |     1 |   104 |     5 |
|  59 |       NESTED LOOPS                      |                     |     1 |    86 |     4 |
|  60 |        NESTED LOOPS                     |                     |     4 |   264 |     3 |
|  61 |         NESTED LOOPS                    |                     |     2 |    86 |     2 |
|* 62 |          INDEX RANGE SCAN               | S_PARTY_PER_U1      |     2 |    46 |     4 |
|  63 |          TABLE ACCESS BY INDEX ROWID    | S_POSTN             |     1 |    20 |     1 |
|* 64 |           INDEX UNIQUE SCAN             | S_POSTN_P1          |     1 |       |       |
|* 65 |         INDEX RANGE SCAN                | S_PARTY_PER_U1      |     2 |    46 |     3 |
|* 66 |        INDEX RANGE SCAN                 | S_PARTY_RPT_REL_U2  |     1 |    20 |     1 |
|* 67 |       INDEX RANGE SCAN                  | S_PARTY_CTGRY_U1    |     1 |    18 |     1 |
|* 68 |      TABLE ACCESS BY INDEX ROWID        | S_CTLG_CAT          |     1 |    21 |     1 |
|* 69 |       INDEX UNIQUE SCAN                 | S_CTLG_CAT_P1       |     1 |       |       |
|* 70 |     INDEX RANGE SCAN                    | S_CTLG_CAT_PROD_U1  |     1 |    19 |     1 |
|* 71 |    TABLE ACCESS BY INDEX ROWID          | S_CTLG              |     1 |    13 |     1 |
|* 72 |     INDEX UNIQUE SCAN                   | S_CTLG_P1           |     1 |       |       |
|  73 |   NESTED LOOPS                          |                     |     1 |    58 |     3 |
|  74 |    NESTED LOOPS                         |                     |     3 |   135 |     2 |
|* 75 |     INDEX RANGE SCAN                    | S_CTLG_CAT_PROD_U1  |     2 |    38 |     2 |
|* 76 |     TABLE ACCESS BY INDEX ROWID         | S_CTLG_CAT          |     1 |    26 |     1 |
|* 77 |      INDEX UNIQUE SCAN                  | S_CTLG_CAT_P1       |     1 |       |       |
|* 78 |    TABLE ACCESS BY INDEX ROWID          | S_CTLG              |     1 |    13 |     1 |
|* 79 |     INDEX UNIQUE SCAN                   | S_CTLG_P1           |     1 |       |       |
-----------------------------------------------------------------------------------------------

该SQL涉及近四十个表和索引的链接操作,而且全部采用嵌套循环链接模式,是典型的siebel应用。这个SQL的执行计划十分复杂,我甚至不愿意去看它;既然从执行计划上进一步分析过于违背“惰性”,我首先想到的还是从wait interface入手,毕竟OWI是”useless”的。因为无法远程操作,反复收集信息会让整个过程十分缓慢,一口气问对方要了10046,errorstack,latches的dump信息,以及该数据库的完整RDA报告。

既然是latch free等待,那么总要先定位到相关的latch才好进一步分析,我们首先看10046 trace:

cat    siebdb1_ora_15465.trc |grep "nam='latch free'"|awk '{print $7}' |sort|uniq    -c
1 p1=-4611685984823284696
169 p1=-4611685984823317640
1 p1=-4611685988591416672
1 p1=-4611685988592487696
2 p1=-4611685988692060472
1 p1=-4611685988694684144
1 p1=-4611685988705526816
1 p1=-4611685988733017136
1 p1=-4611685988779484112
1 p1=-4611685988784059264
1 p1=-4611685988787329592
1 p1=-4611685988788323152
1 p1=-4611685988800312448
2 p1=-4611685988805347840
24 p1=-4611685988806714976
2 p1=-4611685988837854328
7 p1=-4611685988841028520
1 p1=-4611685988869432648
1 p1=-4611685988871320920

通过以上脚本处理,我们可以看到在执行过程中出现了各种latch free,出现最频繁的是p1=-4611685984823317640的栓。latch free等待事件中p1所代表的是会话所等待栓的地址。-4611685984823317640换算到16进制为C0000007D2F56B78。我们看看这个栓到底是何方神圣:

 c0000007d2f56b78 cache buffer handles level=3
        Location from where latch is held: kcbzfs:
        Context saved from call: 0
        state=busy
  gotten 2734921346 times wait, failed first 656272521 sleeps 44808579
  gotten 0 times nowait, failed: 0

当会话需要pin住buffer header时它首先要获去buffer handle,得到buffer handle的过程中首先要抢占cache buffer handles栓,为了避免对于cache buffer handles栓的过度争用,每个会话被允许cache一小撮buffer handles,也叫保留集(reserved set)。该保留集的上限由隐式参数_db_handles_cached(默认为5)所控制,在此基础上会话在执行不是十分复杂的SQL时不必反复申请栓。
同时存在一些十分复杂的语句,需要同时pin住大量的缓存,此时若存在空闲的handle,会话被允许索要手头5个cached buffer handles以外的handle。也为了限制单个会话的资源占用量,Oracle通过内部算法总是尽量让每个进程能够pin住”合理份额“的buffer,由此单个会话同一时间所能持有的总handle数等于db_block_buffers/processes,隐式参数_cursor_db_buffers_pinned指出了该值。另cache buffer handles并没有子栓,仅有父栓本身,所以如果系统中有大量复杂SQL,会话所能cache的buffer handles远不足以满足需求时,该栓就成为整个系统性能的瓶颈,甚至可能出现潜在的死锁/饿死问题。
结合我们从trace中获取的实际信息,cache buffer handles的命中率为1-656272521/2734921346=76%;一般来说如果系统中某个栓的命中率低于95%时,我们就可以认为该栓的争用较为激烈了;而此处一个父栓的命中率到了80%以下,我们很难想象其性能恶化状态。
在同事发给我的RDA中探索,从resource limit栏目中可以看到该实例的会话高水位从未超过2500,而实例设定的processes值则为6000,这是一个很多初级DBA或施工方会犯的错误,认为设定高一些的processes值可以避免出现ora-00020错误从而高枕无忧,殊不知Oracle中许多隐式参数的分配是针对process数来计算的,资源总数是有限的,process数多则单个会话所能操控的理论资源数相应减少,这不仅在Oracle中,几乎是放之四海皆准的原理。
极有可能是过高的processes参数影响了_cursor_db_buffers_pinned,而该问题SQL除了十分复杂外还有全部采用nested loop链接方式的问题,这就要求同时时刻需pin住大量不同表和索引的buffer,于是在SQL执行伊始会话尝试pin住了一部分的buffer,但因为最终达到了_cursor_db_buffers_pinned所指定的上限,该会话在持有cache buffer handles栓的情况下处于hang状态,进一步导致了大量其他会话因latch free等待而阻塞。
当时给同事的最主要建议就是降低processes参数,从该系统的V$resource_limit动态视图来看,将processes设到3000就绰绰有余了;同时我们可以增大隐式参数_db_handles_cached以避免系统中对该栓的争用。

几天后,同事回信告诉我开发人员通过其他途径绕过了该问题,但我还是建议他在未来可能的offline计划中加入修改processes和_db_handles_cached参数的操作。

这个case发生几个月后,我无意中从MOS中发现以下note:

Hdr: 9328032 10.2.0.3 RDBMS 10.2.0.3 BUFFER CACHE PRODID-5 PORTID-23
Abstract: INCREASE IN CACHE BUFFER CHAINS/HANDLES WAITS

*** 01/29/10 05:41 am ***
TAR:
----
3-1375394871

PROBLEM:
--------
Today, and despite no significant change in workload we have increased waits
on these two latches:

29Jan2010_1030_1045 : Top 5 Timed Events
   Avg %Total
29Jan2010_1030_1045 : ~~~~~~~~~~~~~~~~~~
  wait   Call
29Jan2010_1030_1045 : Event                                 Waits    Time (s)
  (ms)   Time Wait Class
29Jan2010_1030_1045 : ------------------------------ ------------ -----------
------ ------ ----------
29Jan2010_1030_1045 : db file sequential read           4,912,142      50,169
    10   40.7   User I/O
29Jan2010_1030_1045 : CPU time                                         45,456
         36.9
29Jan2010_1030_1045 : latch: cache buffers chains       1,347,911      12,255
     9   10.0 Concurrenc
29Jan2010_1030_1045 : latch: cache buffer handles       1,364,489      10,662
     8    8.7      Other
29Jan2010_1030_1045 : log file sync                       482,281       7,101
    15    5.8     Commit
29Jan2010_1030_1045 :
-------------------------------------------------------------     

DIAGNOSTIC ANALYSIS:
--------------------
See below

WORKAROUND:
-----------
None

RELATED BUGS:
-------------

REPRODUCIBILITY:
----------------

TEST CASE:
----------

STACK TRACE:
------------

SUPPORTING INFORMATION:
-----------------------

24 HOUR CONTACT INFORMATION FOR P1 BUGS:
----------------------------------------

DIAL-IN INFORMATION:
--------------------

IMPACT DATE:
------------ 
Notes so far:

There seems to be 5 - 12% increase across a number of statistics
between the OK sample and the problem sample.
eg:                          Total           per second  per TX
  26th> execute count       6,322,503        7,025.2      14.6
  29th> execute count       6,828,911        7,552.3      14.7
        8% increase in execute count

  26th> data blocks consistent reads - u 16,567,225  18,408.4  38.2
  29th> data blocks consistent reads - u 18,700,073  20,681.1  40.3
        12.6% increase in consistent read undo records applied

cache buffer handles
~~~~~~~~~~~~~~~~~~~~
 There is about an 8% increase in gets of this latch between
 the two reports:
                               Gets        miss%   wait time
  26th> cache buffer handles  80,320,092   21.0        56
  29th> cache buffer handles  87,158,750   55.9     10661

 And the latch was already showing 21% miss rate before so was
 showing signs of being close to becoming a problem.

 The latch misses stats show:
                            Location      Sleeps   Waiter Sleeps
   cache buffer handles     kcbzgs        726,520  832,967
   cache buffer handles     kcbzfs        638,106  531,875

 This latch is used just to get / release buffer state objects.

 Each process caches up to "_db_handles_cached" of these against
 its own process so once we are warmed up and have processes
 then we should only use this latch if we are after pinning more
 than 5 buffers in the process state.

 As the misses seem balanced across kcbzgs and kcbzfs then the
 gets do not appear to be due to warming up so this points at
 SQLs on the system needing to pin more than 5 buffers at a
 time. If we increase "_db_handles_cached" then we should be able
 to alleviate the load on this latch.

 eg: See PID 4174 from yesterday we see it has 9 buffers pinned
     and is running:
       SELECT   /*+ LEADING (PROD, ITM, ORDX)
          INDEX (ITM S_ORDER_ITEM_BT_W1_X )*/ ...
     So we can see there are SQLs needing many more than 5 buffers
     pinned at a time.
*** 01/29/10 10:06 am ***
cache buffers chains
~~~~~~~~~~~~~~~~~~~~            GETS           Miss%
 26th>  cache buffers chains    866,844,547    1.0    0.0     83
 29th>  cache buffers chains    900,769,954    1.4    0.1  12258
        4% increase in gets , large increase in wait time.

 Previous miss rate was 1%, now 1.4%.

 James already checked and mostly the spread looks reasonable
  across child latches.
                                           per second
     26th>     Transactions:                481.56
     29th>     Transactions:                513.79
               6.5% more transactions processed.

 This is looking like increased load is starting to see the
 latch contention. It may be sensible here to look at the
 higher "buffer gets" SQLs to see if they really are well
 tuned. eg: 8y9msp8p3gv23 in the 1130-1145 reports are
 showing increased executions but also increased buffers
 per execution. It would seem sensible to check out the
 plans and use of the top buffer gets SQLs.

 It would also be wise to confirm we are not hitting bug 6455161
 as that affects this release and I cannot see that patch in place.
 ie: Verify:
     select owner||'.'||Object_name||'.'||subobject_name
       from dba_objects
      where object_id<>data_object_id
        and object_type like 'INDEX%'
      order by owner,object_name,subobject_name;
 That would not be a difference from 26th but if this is hit
 you gets may be far higher than needed for certains types of
 query.
*** 01/29/10 02:14 pm *** (CHG: Sta->11)
*** 01/29/10 02:14 pm ***
*** 01/29/10 02:40 pm *** (CHG: Sta->16)
*** 01/29/10 03:03 pm ***
*** 01/29/10 11:33 pm ***
Many of the indexes are on SIEBEL objects so
bug 6455161 looks like it could occur here.
*** 01/30/10 12:02 am ***
*** 01/30/10 12:41 am ***
I checked a few top buffer gets SQLs from older AWR that we have
awrrpt_1_67673_67677 . It looks like the heaviest SQLs are
probably not using indexes which are exposed to 6455161 but a couple
may be:

 av5skvp0mkxm1
  SELECT /*+ ALL_ROWS */ T3.CONFLICT_ID, T3.LAST_UPD ...
  FROM SIEBEL.S_LST_OF_VAL T1, SIEBEL.S_SRM_ACTION T2, SIEBEL.S_SRM_ACTION T3

   ...

  Indexes on the q1.log list which might be used by that query in NL:
    SIEBEL.S_SRM_ACTION_M1    SIEBEL.S_SRM_ACTION_P1
    SIEBEL.S_SRM_ACTION_U1
    SIEBEL.S_SRM_ACT_PARAM_P1 SIEBEL.S_SRM_ACT_PARAM_U1

 7khg9mx4cv5c5
  Queries from SIEBEL.S_ORG_EXT with lots of other tables

  Might use SIEBEL.S_ORG_EXT_M1 from the list
*** 01/30/10 12:59 am ***
=====
>>> Side issue unrelated to the issue here:
      From patch list patches_28012010.lis
      customer has 6868080 installed. This was superceded by 8244734
=====
*** 01/30/10 07:06 am *** (CHG: Sta->10)
*** 01/30/10 07:06 am ***
Suggestions for this:

a> Set "_db_handles_cached" >= 10

b> Get and install a patch for bug 6455161
    This seems like this is minimal impact at present
    as problem indexes are not used in the top buffer
    gets SQLs BUT one index rebuild could lead to mass
    problems, and it may give some small reductions
    in buffer gets on certain SQLs, just not the top
    ones.
    It is a small focused fix with no clashes on current
    list.

c> Double check some of the top buffer gets SQL plans.
    They may be the best they could be but are worth
    checking as there is little in the AWRs to show
    any special reason for cache buffers chains increase
    other than the slightly higher workload.
*** 02/01/10 07:32 am ***

>> SQL "av5skvp0mkxm1" may be susceptible to 6455161.
*** 02/01/10 08:03 am ***
Reviewing level of "_db_handles_cached" as some of the top
SQLs seem very deep NL outer.

Testing this here.

*** 02/01/10 11:05 am ***
For repeatedly executed deep NL SQLs higher handle caching should
improve loading on the "cache buffer handles" latch, but it
has no impact on the chains latch as NLs and NL outers keep buffers
pinned anyway.

So suggestions are still>>
 Set "_db_handles_cached" >= 40 (given nested depth of some SQL)
   See if extra memory should be added to shared pool to accomodate that

 Install 6455161

 Drill more into SQL to see if any can be improved esp wrt buffer
  gets needed .
 Also
   Recheck V$latch_children spread for cache buffers chains
   and recheck X$BH blocks on warmest children
   See if there is any session skew on the latch waits
   (any sessions more prone to waits than others)

该note所述case与我们的情况相似,经过排查发现最有”嫌疑“的SQL语句中也存在大量的Nested Loop外连接。这似乎是siebel应用一个普遍存在的问题,note中的客户最初发现的症结也是cache buffer handles栓等待问题,Oracle MOS最后给出的建议是:

1.增大db_handles_cache 到10以上,最后又建议增加到40以上

2. 这个note中客户的数据库版本是sparc(64 bit) 10.2.0.3, MOS建议在此基础上应用Bug 6455161的one-off patch

3.检查有大量buffer gets的SQL语句的执行计划

转储控制文件信息

当前控制文件的内容可以通过CONTROLF dump以文本形式转储到实例参数指定的目录下。

各级别CONTROLF转储的区别:

转储级别 转储内容
1 仅包含文件头信息
2 包括文件头,数据库信息记录,检查点进程记录
3 所有记录类型,针对循环重用的记录类型仅保留最早及最近的记录
4 如上,包含4条最新的可重用类型的记录
5+ 如上,包含的可重用类型记录为2*level条
SQL> oradebug setmypid;
Statement processed.
SQL> oradebug dump controlf 3;
Statement processed.
SQL> oradebug tracefile_name;
/s01/rac10g/admin/PROD/udump/prod_ora_3710.trc

以下例而言,使用oradebug命令启动转储,将会把当前控制文件信息以文本形式转储到该服务进程对应的用户转储文件中,文本中记录了level 3所对应的内容。

SQL> oradebug setmypid;
Statement processed.
SQL> oradebug dump controlf 3;
Statement processed.
SQL> oradebug tracefile_name;
/s01/rac10g/admin/PROD/udump/prod_ora_3710.trc

oradebug必须以SYSDBA形式登陆后方能使用,你也可以以非SYSDBA的身份通过alter session形式启动转储:

SQL> alter session set events 'immediate trace name controlf level 3';

Session altered.

[gview file=”http://askmac.cn/wp-content/uploads/resource/Controlfile.doc”]

巧用close_trace命令释放误删trace文件

可能很多朋友都遇到过这样的情况,在UNIX/Linux上定期清理Oracle日志文件夹时可能删除到仍被后台进程open着的trace文件,即某些后台进程一直持有着这些”被已经误删了的“打开文件的描述符(fd),这种情况下文件系统上该文件实际占用的空间是不会被释放的,这就造成使用df命令查看文件系统剩余空间和用du命令查看文件夹空间使用量时数值不一致的问题。此外因为是后台进程持有这些打开文件描述符,所以我们无法像kill服务进程一样来解决该问题(部分后台进程是可以kill的,不建议这样做)。oradebug是sqlplus中威力强大的debug命令,我们可以通过该命令发起多种trace/dump,其中也包括了close_trace事件;close_trace事件可以让指定进程关闭其正持有的trace文件。

下面我们就来演示下相关操作:

[maclean@rh2 ~]$ ps -ef|grep ora_|grep -v grep
maclean   7281     1  0 16:35 ?        00:00:00 ora_pmon_PROD
maclean   7283     1  0 16:35 ?        00:00:00 ora_psp0_PROD
maclean   7285     1  0 16:35 ?        00:00:00 ora_mman_PROD
maclean   7287     1  0 16:35 ?        00:00:00 ora_dbw0_PROD
maclean   7289     1  0 16:35 ?        00:00:00 ora_lgwr_PROD
maclean   7291     1  0 16:35 ?        00:00:00 ora_ckpt_PROD
maclean   7293     1  0 16:35 ?        00:00:00 ora_smon_PROD
maclean   7295     1  0 16:35 ?        00:00:00 ora_reco_PROD
maclean   7297     1  0 16:35 ?        00:00:00 ora_cjq0_PROD
maclean   7299     1  0 16:35 ?        00:00:00 ora_mmon_PROD
maclean   7301     1  0 16:35 ?        00:00:00 ora_mmnl_PROD
maclean   7303     1  0 16:35 ?        00:00:00 ora_d000_PROD
maclean   7305     1  0 16:35 ?        00:00:00 ora_s000_PROD
maclean   7313     1  0 16:35 ?        00:00:00 ora_qmnc_PROD
maclean   7430     1  0 16:35 ?        00:00:00 ora_q000_PROD
maclean   7438     1  0 16:36 ?        00:00:00 ora_q001_PROD

/* lgwr是著名的Oracle后台进程,在这个启动的实例中其系统进程号为7289*/

[maclean@rh2 ~]$ ls -l /proc/7289/fd        /* linux上的proc文件系统可以很方便我们探测进程信息*/
total 0
lr-x------ 1 maclean oinstall 64 Jul 26 16:38 0 -> /dev/null
lr-x------ 1 maclean oinstall 64 Jul 26 16:38 1 -> /dev/null
lr-x------ 1 maclean oinstall 64 Jul 26 16:38 10 -> /dev/zero
lr-x------ 1 maclean oinstall 64 Jul 26 16:38 11 -> /dev/zero
lr-x------ 1 maclean oinstall 64 Jul 26 16:38 12 -> /s01/rac10g/rdbms/mesg/oraus.msb
lrwx------ 1 maclean oinstall 64 Jul 26 16:38 13 -> /s01/rac10g/dbs/hc_PROD.dat
lrwx------ 1 maclean oinstall 64 Jul 26 16:38 14 -> /s01/rac10g/dbs/lkPROD
lrwx------ 1 maclean oinstall 64 Jul 26 16:38 15 -> /s01/rac10g/oradata/PROD/controlfile/o1_mf_64q6xphj_.ctl
lrwx------ 1 maclean oinstall 64 Jul 26 16:38 16 -> /s01/rac10g/flash_recovery_area/PROD/controlfile/o1_mf_64q6xpms_.ctl
lrwx------ 1 maclean oinstall 64 Jul 26 16:38 17 -> /s01/rac10g/oradata/PROD/onlinelog/o1_mf_1_64q6xrsr_.log
lrwx------ 1 maclean oinstall 64 Jul 26 16:38 18 -> /s01/rac10g/flash_recovery_area/PROD/onlinelog/o1_mf_1_64q6xsoy_.log
lrwx------ 1 maclean oinstall 64 Jul 26 16:38 19 -> /s01/rac10g/oradata/PROD/onlinelog/o1_mf_2_64q6xths_.log
l-wx------ 1 maclean oinstall 64 Jul 26 16:38 2 -> /s01/rac10g/admin/PROD/bdump/prod_lgwr_7289.trc
lrwx------ 1 maclean oinstall 64 Jul 26 16:38 20 -> /s01/rac10g/flash_recovery_area/PROD/onlinelog/o1_mf_2_64q6xv9o_.log
lrwx------ 1 maclean oinstall 64 Jul 26 16:38 21 -> /s01/rac10g/oradata/PROD/onlinelog/o1_mf_3_64q6xw1b_.log
lrwx------ 1 maclean oinstall 64 Jul 26 16:38 22 -> /s01/rac10g/flash_recovery_area/PROD/onlinelog/o1_mf_3_64q6xwv0_.log
lrwx------ 1 maclean oinstall 64 Jul 26 16:38 23 -> /s01/rac10g/oradata/PROD/datafile/o1_mf_system_64q6wd5j_.dbf
lrwx------ 1 maclean oinstall 64 Jul 26 16:38 24 -> /s01/rac10g/oradata/PROD/datafile/o1_mf_undotbs1_64q6wd7f_.dbf
lrwx------ 1 maclean oinstall 64 Jul 26 16:38 25 -> /s01/rac10g/oradata/PROD/datafile/o1_mf_sysaux_64q6wd5m_.dbf
lrwx------ 1 maclean oinstall 64 Jul 26 16:38 26 -> /s01/rac10g/oradata/PROD/datafile/o1_mf_users_64q6wd89_.dbf
lrwx------ 1 maclean oinstall 64 Jul 26 16:38 27 -> /s01/rac10g/oradata/PROD/datafile/o1_mf_temp_64q6xyox_.tmp
lr-x------ 1 maclean oinstall 64 Jul 26 16:38 28 -> /s01/rac10g/rdbms/mesg/oraus.msb
lr-x------ 1 maclean oinstall 64 Jul 26 16:38 3 -> /dev/null
lr-x------ 1 maclean oinstall 64 Jul 26 16:38 4 -> /dev/null
l-wx------ 1 maclean oinstall 64 Jul 26 16:38 5 -> /s01/rac10g/admin/PROD/udump/prod_ora_7279.trc
l-wx------ 1 maclean oinstall 64 Jul 26 16:38 6 -> /s01/rac10g/admin/PROD/bdump/alert_PROD.log
lrwx------ 1 maclean oinstall 64 Jul 26 16:38 7 -> /s01/rac10g/dbs/lkinstPROD (deleted)
lrwx------ 1 maclean oinstall 64 Jul 26 16:38 8 -> /s01/rac10g/dbs/hc_PROD.dat
l-wx------ 1 maclean oinstall 64 Jul 26 16:38 9 -> /s01/rac10g/admin/PROD/bdump/alert_PROD.log

/*可以看到lgwr进程相关trace文件为/s01/rac10g/admin/PROD/bdump/prod_lgwr_7289.trc,对应打开文件描述符为2*/

[maclean@rh2 ~]$ ls -lh /s01/rac10g/admin/PROD/bdump/prod_lgwr_7289.trc
-rw-r----- 1 maclean oinstall 1.7M Jul 26 16:37 /s01/rac10g/admin/PROD/bdump/prod_lgwr_7289.trc

[maclean@rh2 ~]$ rm -f /s01/rac10g/admin/PROD/bdump/prod_lgwr_7289.trc

/*尝试删除该trace文件*/

[maclean@rh2 ~]$ ls -l /proc/7289/fd|grep lgwr
l-wx------ 1 maclean oinstall 64 Jul 26 16:38 2 -> /s01/rac10g/admin/PROD/bdump/prod_lgwr_7289.trc (deleted)

/*文件已处在deleted状态,但lgwr进程仍持有该文件相关的文件描述符,这个时候该文件占有的空间并不会被释放*/

[maclean@rh2 ~]$ lsof|grep lgwr
oracle 7289   maclean    2w   REG 8,2   1702391 3867134 /s01/rac10g/admin/PROD/bdump/prod_lgwr_7289.trc (deleted)

[maclean@rh2 ~]$ sqlplus / as sysdba

SQL*Plus: Release 10.2.0.5.0 - Production on Mon Jul 26 17:03:04 2010

Copyright (c) 1982, 2010, Oracle.  All Rights Reserved.


Connected to:
Oracle Database 10g Enterprise Edition Release 10.2.0.5.0 - 64bit Production
With the Partitioning, OLAP, Data Mining and Real Application Testing options

SQL> oradebug setospid 7289;
Oracle pid: 6, Unix process pid: 7289, image: oracle@rh2 (LGWR)
SQL> oradebug flush;             /*写出trace buffer内容到trace文件*/
Statement processed.
SQL> oradebug close_trace;
Statement processed.
/*close_trace能够释放指定Oracle进程正打开着的文件,To close the current trace file use*/
SQL> host
[maclean@rh2 ~]$ lsof|grep lgwr

[maclean@rh2 ~]$ ls -l /proc/7289/fd/|grep lgwr
[maclean@rh2 ~]$
/* 从进程相关的fd文件夹中查找不到原来的trace文件;close_trace命令成功释放了该文件,并回收了磁盘空间。*/

_shared_pool_reserved_pct or shared_pool_reserved_size with ASMM

共享池是Oracle著名的SGA的一个重要组成部分,当我们尝试从共享池中分配较大的连续区域时(默认来说是4400bytes),我们可能会用到共享池中的保留区域(也叫保留池);注意Oracle总是会先尝试扫描普通共享池的空闲列表,之后才尝试扫描保留池的空闲列表,无论所需分配的内存块是否超过隐式参数_shared_pool_reserved_min_alloc所指定的值。

什么?你看到过的4031描述文档是用以下伪代码描述分配流程的:

large, scan reserved list
if (chunk found)
check chunk size and perhaps truncate
if (chunk is not found)
scan regular free list
if (chunk found)
check chunk size and perhaps truncate
all done
if (chunk is not found)
do LRU operations and repeat

small, scan regular free list
if (chunk found)
check chunk size and perhaps truncate
all done
if (chunk is not found)
do LRU operations and repeat

那么来看看以下测试:

SQL> alter system set "_shared_pool_reserved_pct"=5 scope=spfile;

System altered.

SQL> startup frce;
SP2-0714: invalid combination of STARTUP options
SQL> startup force;
ORACLE instance started.

Total System Global Area 3154116608 bytes
Fixed Size                  2099616 bytes
Variable Size            2197816928 bytes
Database Buffers          939524096 bytes
Redo Buffers               14675968 bytes
Database mounted.
Database opened.
SQL>  select free_space from v$shared_pool_reserved;

FREE_SPACE
----------
3525368

SQL> SELECT x.ksppinm NAME, y.ksppstvl VALUE, x.ksppdesc describ
2   FROM SYS.x$ksppi x, SYS.x$ksppcv y
3   WHERE x.inst_id = USERENV ('Instance')
4   AND y.inst_id = USERENV ('Instance')
5   AND x.indx = y.indx
6  AND x.ksppinm LIKE '%_shared_pool_reserved_min_alloc%';

NAME                            VALU DESCRIB
------------------------------- ---- ---------------------------------------------------------------------
_shared_pool_reserved_min_alloc 4400 minimum allocation size in bytes for reserved area of shared pool

SQL> select count(*) from x$ksmsp where ksmchsiz>4400 and ksmchcom!='free memory';

COUNT(*)
----------
64

SQL>  exec dbms_workload_repository.create_snapshot;

PL/SQL procedure successfully completed.
SQL> select count(*) from x$ksmsp where ksmchsiz>4400 and ksmchcom!='free memory';

COUNT(*)
----------
67                            /* 方才调用的存储过程成功在共享池中分配到3个大于4400 byte的Chunk,接下来看保留池大小变化)
SQL>  select free_space from v$shared_pool_reserved;

FREE_SPACE
----------
3525368               /* 保留池大小没有发生变化,很显然3个大于4400 byte的Chunk是从regular free list上获取的,而非reserved free list/

以上实验中我们通过调用awr快照存储过程,模拟了从共享池中分配大于4400字节Chunk的操作,实验结果是在保留池有足够空闲空间的情况下,Oracle仍尝试在普通共享池区域中分配了这些连续内存,故而通过查询内部视图x$ksmsp虽然发现了多出了三个大于4400 byte的Chunk,然而保留池的空闲量并未减少。由此可证即便是要分配大于4400字节的内存块,Oracle也会先尝试搜索普通空闲列表,在普通空闲列表上无适应尺寸的连续空间时,才会尝试扫描保留池的空闲列表。

言归正题,我们可以通过2个参数控制保留池的大小:shared_pool_reserved_size和_shared_pool_reserved_pct。这2个参数的区别在于普通参数shared_pool_reserved_size以数值形式制定保留池的大小,这个数值采用在10g的ASMM(自动管理的SGA内存管理)特性的环境中是不会随共享池的大小变化而浮动的;不同于此,隐式参数_shared_pool_reserved_pct作为一个比例值,可以协同ASMM中共享池的变化而适应变化。在讨论经典4031错误的数个文档中,都有介绍到如果在ASMM环境中,设置_shared_pool_reserved_pct往往要好过shared_pool_reserved_size,它使你的共享池更具可收缩性!

纸上得来终觉浅,我们来看看_shared_pool_reserved_pct的实际效果:

SQL> alter system set sga_max_size=3000M scope=spfile;

System altered.

SQL> alter system set sga_target=3000M scope=spfile;

System altered.

SQL> alter system set shared_pool_size=500M;

System altered.

SQL> alter system set "_shared_pool_reserved_pct"=50 scope=spfile;

System altered.

SQL> startup force ;
ORACLE instance started.

Total System Global Area 3154116608 bytes
Fixed Size                  2099616 bytes
Variable Size             570426976 bytes
Database Buffers         2566914048 bytes
Redo Buffers               14675968 bytes
Database mounted.
Database opened.
SQL> select free_space from v$shared_pool_reserved;

FREE_SPACE
----------
21158280
SQL> alter system set shared_pool_size=2000M ;  /*ASMM下手动修改shared_pool_size,模拟共享池自动扩展的情况*/

System altered.

SQL> select free_space from v$shared_pool_reserved;

FREE_SPACE
----------
21158280                          /*  ohhh!好像跟我们预期的差别挺大,保留池大小没变*/

让我们跑下这段产生反复硬解析的SQL:

begin
for i in 1..200000 loop
execute immediate 'select 2 from dual where 1='||i;
end loop;
end;
/

SQL> select free_space from v$shared_pool_reserved;

FREE_SPACE
----------
296215920                                          /* 这样好了,我们如愿了,SGA真"动态" /

SQL>  alter system set shared_pool_size=300M;   /*尝试收缩ASMM下的共享池*/

System altered.

SQL>  alter system flush shared_pool;

System altered.

SQL> select free_space from v$shared_pool_reserved;

FREE_SPACE
----------
296215920                           /* 我们甚至无法flush 掉这些内存,这挺要命的 /

SQL> select name ,value/1024/1024 "SIZE MB" from v$system_parameter where name in ('sga_target','sga_max_size','shared_pool_size','db_cache_size','java_pool_size','large_pool_size','db_keep_cache_size');

NAME                    SIZE MB
-------------------- ----------
sga_max_size               3008
shared_pool_size            304
large_pool_size              16
java_pool_size               16
sga_target                 3008
db_cache_size               512
db_keep_cache_size            0

可以看到我们还有很多“没有分配”的SGA内存,我们来加大高速缓存看看:
SQL> alter system set db_cache_size=1000M;
alter system set db_cache_size=1000M
*
ERROR at line 1:
ORA-32017: failure in updating SPFILE
ORA-00384: Insufficient memory to grow cache      /* ohh 因为无法回收保留池的大量内存,导致了SGA其他组件无法扩展/

_shared_pool_reserved_pct的默认值5%可以满足绝大多数情况,通过上述实验证明设置该percent参数可以使保留池大小随SGA动态调整而扩大;但通过再次调整shared_pool_size和flush shared_pool手段都无法回收过度分配的保留池空间,这会导致其他组件无法正常扩展;因而我们在10gASMM的背景下,通过设置_shared_pool_reserved_pct可以获得更好的效果,但因为存在回收空间的问题,该参数也不宜设置过大,如果默认值在您的场景中显得过小,那么您可以尝试使用5-20这个区间内的值,超过20%的话往往就会造成负面的影响了。

ora-00600:[17281], [1001]一例

检查告警日志发现出现ora-600:[17281],[1001]记录,该数据库版本为10.2.0.4:

ORA-00600: internal error code, arguments: [17281], [1001], [0x70000042F5E54F8], [], [], [], [], []
ORA-01001: invalid cursor

分析该600错误产生的trace文件,发现当时运行的语句是一段匿名块:

Current SQL statement for this session:
declare
t_owner varchar2(30);
t_name  varchar2(30);
procedure check_mview is
dummy integer;
begin
if :object_type = ‘TABLE’ then
select 1 into dummy
from sys.all_objects
where owner = :object_owner
and object_name = :object_name
and object_type = ‘MATERIALIZED VIEW’
and rownum = 1;
:object_type := ‘MATERIALIZED VIEW’;
end if;
exception
when others then null;
end;
begin
:sub_object := null;
if :deep != 0 then
begin
if :part2 is null then
select constraint_type, owner, constraint_name
into :object_type, :object_owner, :object_name
from sys.all_constraints c
where c.constraint_name = :part1 and c.owner = user
and rownum = 1;
else
select constraint_type, owner, constraint_name, :part3
into :object_type, :object_owner, :object_name, :sub_object
from sys.all_constraints c
where c.constraint_name = :part2 and c.owner = :part1
and rownum = 1;
end if;
if :object_type = ‘P’ then :object_type := ‘PRIMARY KEY’; end if;
if :object_type = ‘U’ then :object_type := ‘UNIQUE KEY’; end if;
if :object_type = ‘R’ then :object_type := ‘FOREIGN KEY’; end if;
if :object_type = ‘C’ then :object_type := ‘CHECK CONSTRAINT’; end if;
return;
exception
when no_data_found then null;
end;
end if;
:sub_object := :part2;
if (:part2 is null) or (:part1 != user) then
begin
select object_type, user, :part1
into :object_type, :object_owner, :object_name
from sys.all_objects
where owner = user
and object_name = :part1
and object_type in (‘MATERIALIZED VIEW’, ‘TABLE’, ‘VIEW’, ‘SEQUENCE’, ‘PROCEDURE’, ‘FUNCTION’, ‘PACKAGE’, ‘TYPE’, ‘TRIGGER’, ‘SYNONYM’)
and rownum = 1;
if :object_type = ‘SYNONYM’ then
select s.table_owner, s.table_name
into t_owner, t_name
from sys.all_synonyms s
where s.synonym_name = :part1
and s.owner = user
and rownum = 1;
select o.object_type, o.owner, o.object_name
into :object_type, :object_owner, :object_name
from sys.all_objects o
where o.owner = t_owner
and o.object_name = t_name
and object_type in (‘MATERIALIZED VIEW’, ‘TABLE’, ‘VIEW’, ‘SEQUENCE’, ‘PROCEDURE’, ‘FUNCTION’, ‘PACKAGE’, ‘TYPE’, ‘TRIGGER’, ‘SYNONYM’)
and rownum = 1;
end if;
:sub_object := :part2;
if :part3 is not null then
:sub_object := :sub_object || ‘.’ || :part3;
end if;
check_mview;
return;
exception
when no_data_found then null;
end;
end if;
begin
select s.table_owner, s.table_name
into t_owner, t_name
from sys.all_synonyms s
where s.synonym_name = :part1
and s.owner = ‘PUBLIC’
and rownum = 1;
select o.object_type, o.owner, o.object_name
into :object_type, :object_owner, :object_name
from sys.all_objects o
where o.owner = t_owner
and o.object_name = t_name
and object_type in (‘MATERIALIZED VIEW’, ‘TABLE’, ‘VIEW’, ‘SEQUENCE’, ‘PROCEDURE’, ‘FUNCTION’, ‘PACKAGE’, ‘TYPE’, ‘TRIGGER’, ‘SYNONYM’)
and rownum = 1;
check_mview;
return;
exception
when no_data_found then null;
end;
:sub_object := :part3;
begin
select o.object_type, o.owner, o.object_name
into :object_type, :object_owner, :object_name
from sys.all_objects o
where o.owner = :part1
and o.object_name = :part2
and object_type in (‘MATERIALIZED VIEW’, ‘TABLE’, ‘VIEW’, ‘SEQUENCE’, ‘PROCEDURE’, ‘FUNCTION’, ‘PACKAGE’, ‘TYPE’, ‘TRIGGER’, ‘SYNONYM’)
and rownum = 1;
check_mview;
return;
exception
when no_data_found then null;
end;
begin
if :part2 is null and :part3 is null
then
select ‘USER’, null, :part1
into :object_type, :object_owner, :object_name
from sys.all_users u
where u.username = :part1
and rownum = 1;
return;
end if;
exception
when no_data_found then null;
end;
begin
if :part2 is null and :part3 is null and :deep != 0
then
select ‘ROLE’, null, :part1
into :object_type, :object_owner, :object_name
from sys.session_roles r
where r.role = :part1
and rownum = 1;
return;
end if;
exception
when no_data_found then null;
end;
:object_owner := null;
:object_type := null;
:object_name := null;
:sub_object := null;
end;
—– Call Stack Trace —–
calling              call     entry                argument values in hex
location             type     point                (? means dubious value)
——————– ——– ——————– —————————-
ksedst+001c          bl       ksedst1              088424844 ? 041124844 ?
ksedmp+0290          bl       ksedst               104A54870 ?
ksfdmp+0018          bl       03F30204
kgeriv+0108          bl       _ptrgl
kgeasi+0118          bl       kgeriv               1104722C8 ? 1101B87C0 ?
104AFA0FC ? 7000000100067F8 ?
000000000 ?
kgicli+0188          bl       kgeasi               110195A58 ? 110447310 ?
438100004381 ? 200000002 ?
200000002 ? 000000000 ?
0000003E9 ? 000000002 ?
kgidlt+0398          bl       kgicli               110450A70 ? 104C734E0 ?
kgidel+0018          bl       kgidlt               FFFFFFFFFFF90B8 ? 000000000 ?
000000003 ? 000000000 ?
FFFFFFFFFFF9468 ?
perabo+00ac          bl       kgidel               FFFFFFFFFFF8D20 ? 0000000FF ?
perdcs+0050          bl       perabo               000000000 ? 000000820 ?
000000000 ?
peidcs+01dc          bl       perdcs               110477618 ? 000000000 ?
kkxcls+00a4          bl       peidcs               FFFFFFFFFFF9468 ? 110477618 ?
kxsClean+0044        bl       kkxcls               1100DD338 ?
kxsCloseXsc+0444     bl       kxsClean             FFFFFFFFFFF9760 ?
kksCloseCursor+031c  bl       kxsCloseXsc          110478688 ? 110281FB0 ?
opicca+00c4          bl       kksCloseCursor       104BD9640 ?
opiclo+00a0          bl       opicca               10013D940 ?
kpoclsa+0050         bl       03F32B00
opiodr+0ae0          bl       _ptrgl
ttcpip+1020          bl       _ptrgl
opitsk+1124          bl       01F9F2A0
opiino+0990          bl       opitsk               000000000 ? 000000000 ?
opiodr+0ae0          bl       _ptrgl
opidrv+0484          bl       01F9E0E8
sou2o+0090           bl       opidrv               3C02DC1BBC ? 44065F000 ?
FFFFFFFFFFFF3A0 ?
opimai_real+01bc     bl       01F9B9F4
main+0098            bl       opimai_real          000000000 ? 000000000 ?
__start+0098         bl       main                 000000000 ? 000000000 ?


first argument为17281,该代码对应为在关闭游标时发生错误事件。
发生错误时的调用栈为:kkxcls->peidcs->perdcs->perabo->kgidel->kgidlt->kgicli,通过以上调用栈与argument信息在600 lookup工具中查询,可以发现bug:[6051353]:

Hdr: 6051353 10.1.0.45 THIN 10.1.0.5 PRODID-972 PORTID-212 ORA-600
Abstract: ORA-600[17281] ORA-[1001]

*** 05/14/07 07:09 am ***
TAR:
----
17450130.600

PROBLEM:
--------
Oracle 10.1.0.5 64-bit
AIX5L 64-bit server

Following the application of CPUJAN2007 patch, the database is giving
internal errors.
Tha alert log sjows:
  ORA-600: internal error code, arguments: [17281], [1001],
[0x70000001E792DC8], [], [], [], [], []
  ORA-1001: invalid cursor

Trace file shows the failing statement is an insert.

INSERT INTO V_RPMORGRESOURCEPOSITION
(ORGID, RESOURCEID, EFFECTIVEDAY, TERMINATIONDAY, OWNEDMW,
COMMITTEDMW, AVAILABLEMW, UNOFFEREDMW, FRRCOMMITTEDMW )
SELECT :B12 , :B11 , EFFECTIVEDAY, LEAST(:B10 , :B9 ),
NVL(OWNEDMW,0) + NVL(:B8 ,0), NVL(COMMITTEDMW,0) + NVL(:B7 ,0),
NVL(AVAILABLEMW,0) + NVL(:B6 ,0), NVL(UNOFFEREDMW,0) + NVL(:B5 ,0),
NVL(FRRCOMMITTEDMW,0) + NVL(:B4 ,0)
FROM RPMORGRESOURCEPOSITION
WHERE ORGID = :B3 AND RESOURCEID = :B2 AND EFFECTIVEDAY = :B1

    Other information:
        O/S info: user: , term: , ospid: 1234, machine: esu03als
        client info: smartino@PJM
        application name: eRpm
        action name: QueryZonalLoadObligationDetail
        last wait for 'SQL*Net message from client'

DIAGNOSTIC ANALYSIS:
--------------------
the function stack exactly matches 4359111
kgicli kgidlt kgidel perabo
    Bug 4359111 - STRESS ORA-600[17281] WHEN RUNNING GMT APPLICATION13
But this is already fixed in 10.1.0.5

The 'client' (esu03als) is a Linux server and there is no oracle running
there.

The AIX SysAdmin. who manages the esu03als server says this about the
application:

    "The way RPM connects to our database is by using DBCP (Apache Jakarta
     Project -- see
     As far as I can tell, the release (jar) contained within the RPM
     delivery is version 1.1 of DBCP which was released on 2003-10-20."

This couls also be Bug 5392685/5413487 but tis doesn't seem to have a
resolution.

Also could be Bug 5366763
  possible workaround - set session_cached_cursors to 0
  But this is already set to 0.

Originally the Customer thought this error started after applying CPUJAN2007,
but it is appearing on another database where the CPU patch is not applied.

WORKAROUND:
-----------
none

RELATED BUGS:
-------------
4359111
5413487
5366763

REPRODUCIBILITY:
----------------
intermittent

TEST CASE:
----------
none

STACK TRACE:
------------
          ksedmp ksfdmp kgeriv kgeasi
          kgicli kgidlt kgidel perabo perdcs peidcs kkxcls2 kxtcln
          kxsClean kksCloseCursor opicca opiclo kpoclsa opiodr
          ttcpip opitsk opiino opiodr opidrv sou2o
          main

其调用栈完全一致,可以基本确定2者的关联性。但该文档叙述bug发生在10.1.0.5的AIX版本上,且据称该Bug之前已在“Bug 4359111 – STRESS ORA-600[17281] WHEN RUNNING GMT APPLICATION13”中声明并在10.1.0.5上修复,看起来又是一个伪修复的漏洞。另外一个文档叙述了同样的错误发生在10.2.0.4上:

Hdr: 8337808 10.2.0.4 RDBMS 10.2.0.4 PRG INTERFACE PRODID-5 PORTID-46 ORA-600 4359111
Abstract: ORA-600 [17281] [1001] EVEN AFTER APPLYING THE PATCH 4359111

In prod_ora_12985.trc we see that:
 O/S info: user: Arun?Sharma, term: ARUN, ospid: 2556:3300,
 machine: BVM-EDP\ARUN
Got the ORA-600 at 2009-04-17 13:27:21 .

From the trace this was likely because the PLSQL block in
cursor #2 has an instantiation entry indicating that it
has cursor #3 open:
 INSTANTIATION OBJECT: object=0xf60e9ed0
 type="PL/SQL"[0] lock=0xa383a928 handle=0xb48def6c body=(nil)
 flags=[40] executions=0
 CURSORS: size=4 count=1 next=3
 index cursor      tag  context flags
 ----- ------ -------- -------- ---------------
     2      3 0xf60d56f4 0xf60f832c LRU/PRS/[03]
            ^here

But there is no cursor#3 so it has likely been closed independently

So the immediate thing to do would be to find out what this OS
user (Arun Sharma) was doing at 13.27 on 17th April from the
ARUN machine under OS pid 2556:3300 ?
 - what was the client program ?
 - what is this clients Oracle RSF version ?
 - what was being done in that client at that time.

It is unlikely that the user will remember such fine detail
so you may want to track the alert log closely and as soon
as you seen the ORA-600 find the O/S user , machine etc..
and try to contact them ASAP to confirm what they were doing
etc.. If we can get a handle on the client version / program /
actions that may help. Beyond that the next step is likely
to need a diagnostic on the server side to note cursor close
operations from the client without extranoues additional trace.

From the above update his client is TOAD using 8.0.6.0 on Windows.
TOAD is known to be affected by bug 4359111 so
you should upgrade this client to a version where
bug 4359111 is fixed. (4359111 is a CLIENT SIDE fix)

Marking as an unconfirmed duplicate of bug 4359111
as it looks like some specific client may be connecting
which does not have that patch in place.

与以上文档描述相同,trace中存在以下记录:

INSTANTIATION OBJECT: object=1105e4fe8
type=”PL/SQL”[0] lock=70000044155a8b0 handle=70000042f5e54f8 body=0 level=0
flags=[40] executions=0
CURSORS: size=4 count=3 next=5
index cursor      tag  context flags
—– —— ——– ——– —————
2      4 11049ecc8 110525f60 LRU/PRS/[03]
3      6 11049ecc8 1105261f0 LRU/PRS/[03]
4      5 11049ecc8 110526338 LRU/PRS/[03]

但实际上这里cursor 3所打开的cursor#:4,5,6均不存在,所以cursor# 3也被单独关闭了。文档中问题是由toad引起的,首先toad连接数据库是不需要安装Oracle client的,它通过一些客制化过的c/c++的接口连接到DB;如文档所述可以确定toad V8.0.6.0受到 Bug4359111的影响,而我们的环境中是通过PL/SQL developer连接到数据库的,该工具需要用到Oracle client,而开发人员安装的Oracle client一般为9.2.0.1,极有可能是这一较低版本的客户端软件造成了问题发生,到这里触发Bug的条件基本清晰了。

8i/9i的oracle client虽然仍能够连接到10g,但难保不发生一些兼容性问题或者将早期版本中的Bug再次代入,Oracle对这些连接形式或已不提供技术支持,或提供扩展模式(可能收费)的技术支持。以下列表列出了各版本Server-client的兼容性:


  • #1 – See Note 207319.1
  • #2 – An ORA-3134 error is incorrectly reported if a 10g client tries to connect to an 8.1.7.3 or lower server. See Note 3437884.8 .
  • #3 – An ORA-3134 error is correctly reported when attempting to connect to this version.
  • #4 – There are problems connecting from a 10g client to 8i/9i where one is EBCDIC based. See Note 3564573.8
  • #5 – For connections between 10.2 (or higher) and 9.2 the 9.2 end MUST be at 9.2.0.4 or higher. Connections between 10.2 (or higher) and 9.2.0.1, 9.2.0.2 or 9.2.0.3 are not supported.
  • #6 – For connections between 11.1 (or higher) and 10.1 / 10.2 the 10g end MUST be at 10.1.0.5 / 10.2.0.2 (or higher) respectively in order to use PLSQL between those versions. See Note 4511371.8 for more details.

其实在我们升级或迁移Oracle数据库的时候就因该考虑到客户端软件也需要升级到合适版本才能满足今后兼容性及应用程序健壮度的要求,当然客户端软件并不一定只是oracle client,它可能是jdbc,也许是odbc,也许是dbi等等。

Fail to queue the whole FAL gap in dataguard一例

近日告警日志中出现以下记录:
FAL[server]: Fail to queue the whole FAL gap
GAP – thread 1 sequence 180-180
DBID 3731271451 branch 689955035

这是一个10.2.0.3的dataguard环境,采用物理备库,归档传输模式;查询metalink发现相关note:

Symptoms

When using ARCH transport, gaps could be flagged in the alert log even though the single log gap was for a log that had not been written at the primary yet.

alert.log on primary shows:

FAL[server]: Fail to queue the whole FAL gap

GAP – thread 1 sequence 63962-63962

DBID 1243807152 branch 631898097

or alert.log on standby shows:

Fetching gap sequence in thread 1, gap sequence 63962-63962

Thu Jan 24 14:36:30 2008

FAL[client]: Failed to request gap sequence

GAP – thread 1 sequence 63962-63962

DBID 2004523329 branch 594300676

FAL[client]: All defined FAL servers have been attempted.

v$archive_gap returns no rows

SQL> select * from v$archive_gap;

no rows selected

Cause

Bug 5526409 – FAL gaps reported at standby for log not yet written at primary

Solution

Bug 5526409 is fixed in 10.2.0.4 and 11.1.

Upgrade to 10.2.0.4 as Bug 5526409 is fixed in 10.2.0.4.

Their is no impact of these messages on the database. You can safely ignore these messages.

One-off Patch for Bug 5526409 on top of 10.2.0.3 is available for some platforms. Please check Patch 5526409 for your platform.

该note描述在10.1.0.2-10.2.0.3版本中,在ARCH传输的DataGuard环境中可能出现日志传输gap为单个在primary库中尚未写出的日志,该gap可能会在告警日志中以以上形式标示。
该bug(问题)在版本10.2.0.4和11.1中得到了修复,在10.2.0.3版本中部分平台上有one-off补丁。但实际上该bug(问题)对于主备库不会有任何影响,我们也可以将之忽略。

7月最新发布11.2.0.1.2 Patch set update

7月13日,11g release 2 的第二个补丁集更新发布了;9i的最终版本为9.2.0.8,10g上10.2.0.5很有可能成为最终版本,我们预期今后(11g,12g)中Patch set数量会有效减少,而patch set update数量可能大幅增加;这样的更新形式可以为Oracle Database提升一定的软件形象。可以猜想11gr2的最终版本号可能是11.2.0.2/3.x。

附该psu的readme note:

Released: July 13, 2010

This document is accurate at the time of release. For any changes and additional information regarding PSU 11.2.0.1.2, see these related documents that are available at My Oracle Support (http://support.oracle.com/):

  • Note 854428.1 Patch Set Updates for Oracle Products
  • Note 1089071.1 Oracle Database Patch Set Update 11.2.0.1.2 Known Issues

This document includes the following sections:

1 Patch Information

Patch Set Update (PSU) patches are cumulative. That is, the content of all previous PSUs is included in the latest PSU patch.

PSU 11.2.0.1.2 includes the fixes listed in Section 5, “Bugs Fixed by This Patch”.

Table 1 describes installation types and security content. For each installation type, it indicates the most recent PSU patch to include new security fixes that are pertinent to that installation type. If there are no security fixes to be applied to an installation type, then “None” is indicated. If a specific PSU is listed, then apply that or any later PSU patch to be current with security fixes.

Table 1 Installation Types and Security Content

Installation Type Latest PSU with Security Fixes
Server homes PSU 11.2.0.1.2


Client-Only Installations None
Instant Client Installations None

(The Instant Client installation is not the same as the client-only Installation. For additional information about Instant Client installations, see Oracle Database Concepts.)

2 Patch Installation and Deinstallation

This section includes the following sections:

2.1 Platforms for PSU 11.2.0.1.2

For a list of platforms that are supported in this Patch Set Update, see My Oracle Support Note 1060989.1 Critical Patch Update July 2010 Patch Availability Document for Oracle Products.

2.2 OPatch Utility Information

You must use the OPatch utility version 11.2.0.1.0 or later to apply this patch. Oracle recommends that you use the latest released OPatch 11.2, which is available for download from My Oracle Support patch 6880880 by selecting the 11.2.0.0.0 release.

For information about OPatch documentation, including any known issues, see My Oracle Support Note 293369.1 OPatch documentation list.

2.3 Patch Installation

These instructions are for all Oracle Database installations.

2.3.1 Patch Pre-Installation Instructions

Before you install PSU 11.2.0.1.2, perform the following actions to check the environment and to detect and resolve any one-off patch conflicts.

2.3.1.1 Environments with ASM

If you are installing the PSU to an environment that has Automatic Storage Management (ASM), note the following:

  • For Linux x86 and Linux x86-64 platforms, install either (A) the bug fix for 8898852 and the Database PSU patch 9654983, or (B) the Grid Infrastructure PSU patch 9343627.
  • For all other platforms, no action is required. The fix for 8898852 was included in the base 11.2.0.1.0 release.

2.3.1.2 Environment Checks
  1. Ensure that the $PATH definition has the following executables: make, ar, ld, and nm.The location of these executables depends on your operating system. On many operating systems, they are located in /usr/ccs/bin, in which case you can set your PATH definition as follows:
    export PATH=$PATH:/usr/ccs/bin
    

2.3.1.3 One-off Patch Conflict Detection and Resolution

For an introduction to the PSU one-off patch concepts, see “Patch Set Updates Patch Conflict Resolution” in My Oracle Support Note 854428.1 Patch Set Updates for Oracle Products.

The fastest and easiest way to determine whether you have one-off patches in the Oracle home that conflict with the PSU, and to get the necessary conflict resolution patches, is to use the Patch Recommendations and Patch Plans features on the Patches & Updates tab in My Oracle Support. These features work in conjunction with the My Oracle Support Configuration Manager. Recorded training sessions on these features can be found in Note 603505.1.

However, if you are not using My Oracle Support Patch Plans, follow these steps:

  1. Determine whether any currently installed one-off patches conflict with the PSU patch as follows:
    unzip p9654983_11201_<platform>.zip
    opatch prereq CheckConflictAgainstOHWithDetail -phBaseDir ./9654983
    
  2. The report will indicate the patches that conflict with PSU 9654983 and the patches for which PSU 9654983 is a superset.Note that Oracle proactively provides PSU 11.2.0.1.2 one-off patches for common conflicts.
  3. Use My Oracle Support Note 1061295.1 Patch Set Updates – One-off Patch Conflict Resolution to determine, for each conflicting patch, whether a conflict resolution patch is already available, and if you need to request a new conflict resolution patch or if the conflict may be ignored.
  4. When all the one-off patches that you have requested are available at My Oracle Support, proceed with Section 2.3.2, “Patch Installation Instructions”.

2.3.2 Patch Installation Instructions

Follow these steps:

  1. If you are using a Data Guard Physical Standby database, you must first install this patch on the primary database before installing the patch on the physical standby database. It is not supported to install this patch on the physical standby database before installing the patch on the primary database. For more information, see My Oracle Support Note 278641.1.
  2. Do one of the following, depending on whether this is a RAC environment:
    • If this is a RAC environment, choose one of the patch installation methods provided by OPatch (rolling, all node, or minimum downtime), and shutdown instances and listeners as appropriate for the installation method selected.This PSU patch is rolling RAC installable. Refer to My Oracle Support Note 244241.1 Rolling Patch – OPatch Support for RAC.
    • If this is not a RAC environment, shut down all instances and listeners associated with the Oracle home that you are updating. For more information, see Oracle Database Administrator’s Guide.
  3. Set your current directory to the directory where the patch is located and then run the OPatch utility by entering the following commands:
    unzip p9654983_11201_<platform>.zip
    cd 9654983
    opatch apply
    
  4. If there are errors, refer to Section 3, “Known Issues”.

2.3.3 Patch Post-Installation Instructions

After installing the patch, perform the following actions:

  1. Apply conflict resolution patches as explained in Section 2.3.3.1.
  2. Load modified SQL files into the database, as explained in Section 2.3.3.2.

2.3.3.1 Applying Conflict Resolution Patches

Apply the patch conflict resolution one-off patches that were determined to be needed when you performed the steps in Section 2.3.1.3, “One-off Patch Conflict Detection and Resolution”.

2.3.3.2 Loading Modified SQL Files into the Database

The following steps load modified SQL files into the database. For a RAC environment, perform these steps on only one node.

  1. For each database instance running on the Oracle home being patched, connect to the database using SQL*Plus. Connect as SYSDBA and run the catbundle.sql script as follows:
    cd $ORACLE_HOME/rdbms/admin
    sqlplus /nolog
    SQL> CONNECT / AS SYSDBA
    SQL> STARTUP
    SQL> @catbundle.sql psu apply
    SQL> QUIT
    

    The catbundle.sql execution is reflected in the dba_registry_history view by a row associated with bundle series PSU.

    For information about the catbundle.sql script, see My Oracle Support Note 605795.1 Introduction to Oracle Database catbundle.sql.

  2. Check the following log files in $ORACLE_HOME/cfgtoollogs/catbundle for any errors:
    catbundle_PSU_<database SID>_APPLY_<TIMESTAMP>.log
    catbundle_PSU_<database SID>_GENERATE_<TIMESTAMP>.log
    

    where TIMESTAMP is of the form YYYYMMMDD_HH_MM_SS. If there are errors, refer to Section 3, “Known Issues”.

2.3.4 Patch Post-Installation Instructions for Databases Created or Upgraded after Installation of PSU 11.2.0.1.2 in the Oracle Home

These instructions are for a database that is created or upgraded after the installation of PSU 11.2.0.1.2.

You must execute the steps in Section 2.3.3.2, “Loading Modified SQL Files into the Database” for any new database only if it was created by any of the following methods:

  • Using DBCA (Database Configuration Assistant) to select a sample database (General, Data Warehouse, Transaction Processing)
  • Using a script that was created by DBCA that creates a database from a sample database

2.4 Patch Deinstallation

These instructions apply if you need to deinstall the patch.

2.4.1 Patch Deinstallation Instructions for a Non-RAC Environment

Follow these steps:

  1. Verify that an $ORACLE_HOME/rdbms/admin/catbundle_PSU_<database SID>_ROLLBACK.sql file exists for each database associated with this ORACLE_HOME. If this is not the case, you must execute the steps in Section 2.3.3.2, “Loading Modified SQL Files into the Database” against the database before deinstalling the PSU.
  2. Shut down all instances and listeners associated with the Oracle home that you are updating. For more information, see Oracle Database Administrator’s Guide.
  3. Run the OPatch utility specifying the rollback argument as follows.
    opatch rollback -id 9654983
    
  4. If there are errors, refer to Section 3, “Known Issues”.

2.4.2 Patch Post-Deinstallation Instructions for a Non-RAC Environment

Follow these steps:

  1. Start all database instances running from the Oracle home. (For more information, see Oracle Database Administrator’s Guide.)
  2. For each database instance running out of the ORACLE_HOME, connect to the database using SQL*Plus as SYSDBA and run the rollback script as follows:
    cd $ORACLE_HOME/rdbms/admin
    sqlplus /nolog
    SQL> CONNECT / AS SYSDBA
    SQL> STARTUP
    SQL> @catbundle_PSU_<database SID>_ROLLBACK.sql
    SQL> QUIT
    

    In a RAC environment, the name of the rollback script will have the format catbundle_PSU_<database SID PREFIX>_ROLLBACK.sql.

  3. Check the log file for any errors. The log file is found in $ORACLE_HOME/cfgtoollogs/catbundle and is named catbundle_PSU_<database SID>_ROLLBACK_<TIMESTAMP>.log where TIMESTAMP is of the form YYYYMMMDD_HH_MM_SS. If there are errors, refer to Section 3, “Known Issues”.

2.4.3 Patch Deinstallation Instructions for a RAC Environment

Follow these steps for each node in the cluster, one node at a time:

  1. Shut down the instance on the node.
  2. Run the OPatch utility specifying the rollback argument as follows.
    opatch rollback -id 9654983
    

    If there are errors, refer to Section 3, “Known Issues”.

  3. Start the instance on the node as follows:
    srvctl start instance
    

2.4.4 Patch Post-Deinstallation Instructions for a RAC Environment

Follow the instructions listed in Section Section 2.4.2, “Patch Post-Deinstallation Instructions for a Non-RAC Environment” only on the node for which the steps in Section 2.3.3.2, “Loading Modified SQL Files into the Database” were executed during the patch application.

All other instances can be started and accessed as usual while you are executing the deinstallation steps.

3 Known Issues

For information about OPatch issues, see My Oracle Support Note 293369.1 OPatch documentation list.

For issues documented after the release of this PSU, see My Oracle Support Note 1089071.1 Oracle Database Patch Set Update 11.2.0.1.2 Known Issues.

Other known issues are as follows.

Issue 1
The following ignorable errors may be encountered while running the catbundle.sql script or its rollback script:

ORA-29809: cannot drop an operator with dependent objects
ORA-29931: specified association does not exist
ORA-29830: operator does not exist
ORA-00942: table or view does not exist
ORA-00955: name is already used by an existing object
ORA-01430: column being added already exists in table
ORA-01432: public synonym to be dropped does not exist
ORA-01434: private synonym to be dropped does not exist
ORA-01435: user does not exist
ORA-01917: user or role 'XDB' does not exist
ORA-01920: user name '<user-name>' conflicts with another user or role name
ORA-01921: role name '<role name>' conflicts with another user or role name
ORA-01952: system privileges not granted to 'WKSYS'
ORA-02303: cannot drop or replace a type with type or table dependents
ORA-02443: Cannot drop constraint - nonexistent constraint
ORA-04043: object <object-name> does not exist
ORA-29832: cannot drop or replace an indextype with dependent indexes
ORA-29844: duplicate operator name specified
ORA-14452: attempt to create, alter or drop an index on temporary table already in use
ORA-06512: at line <line number>. If this error follow any of above errors, then can be safely ignored.
ORA-01927: cannot REVOKE privileges you did not grant

4 References

The following documents are references for this patch.

Note 293369.1 OPatch documentation list

Note 360870.1 Impact of Java Security Vulnerabilities on Oracle Products

Note 468959.1 Enterprise Manager Grid Control Known Issues

Note 9352237.8 Bug 9352237 – 11.2.0.1.1 Patch Set Update (PSU)

5 Bugs Fixed by This Patch

This patch includes the following bug fixes.

5.1 CPU Molecules

CPU molecules in PSU 11.2.0.1.2:

PSU 11.2.0.1.2 contains the following new CPU molecules:

9676419 – DB-11.2.0.1-MOLECULE-004-CPUJUL2010

9676420 – DB-11.2.0.1-MOLECULE-005-CPUJUL2010

5.2 Bug Fixes

PSU 11.2.0.1.2 contains the following new fixes:

Automatic Storage Management

8755082 – ORA-00600: [KCFIS_TRANSLATE4:VOLUME LOOKUP], [2], [WRONG DEVICE NAME], [], [], [

8890026 – ASM PARTNERING CREATES IMBALANCED PARTNERSHIPS

9170608 – STBH:DD BLOCKS PINNED FOR QUERIES THAT DO NOT REQUEST USED SPACE

9363145 – STBH:DB INSTANCES TERMINATED BY ASMB DUE TO ORA-00600 [KFDSKALLOC0]

Buffer Cache

8330783 – HANGING DB WITH “CACHE BUFFER CHAINS” AND “BUFFER DEADLOCK” WAITS DURING INSERT

8822531 – TAKING AWR SNAP HANGS

Data Guard Broker

8918433 – UNPERSISTED FSFO STATE BITS CAN GET PERSISTED

9363384 – PHYSICAL STANDBY SERVICES NOT STARTED AFTER CONVERT FROM SNAPSHOT

9467635 – BROKER’S METADATA FILE UPGRADE TO 11.2 IS BROKEN

9467727 – GETSTATUS DOC YIELDS INCORRECT RESULT IF DBRESOURCE_ID PROP VALUE IS USED

Data Guard Logical

8774868 – LGSBFSFO: ORA-600 [3020], [3], [138] RAISED IN RECOVERY SLAVE

8822832 – V$ARCHIVE_DEST_STATUS HAS INCORRECT VALUE FOR APPLIED_SEQ#

DataGuard Redo Transport

8872096 – ARCHIVING FORCED DURING CLOSE WHEN NO STANDBY IS PRESENT

9399090 – STBH: CONSTANT/HIGH FREQUENT LOG SWITCHES ON BEEHIVE DATABASE IN THE LAST 3 DAYS

Shared Cursors

8865718 – RECURSIVE CURSORS CONTAINING “AS OF SNAPSHOT” CLAUSE ARE NOT SHARED

8981059 – HIGH VERSION COUNT:BIND_MISMATCH,USER_BIND_PEEK_MISMATCH,OPTIMIZER_MODE_MISMATCH

9010222 – APPS ST 11G ORA-00600 [KKSFBC-REPARSE-INFINITE-LOOP]

9067282 – TB:SH:ORA-00600:[KKSFBC-WRONG-KKSCSFLGS] WHILE RUNNING TPC-H

DML Drivers

9255542 – ARRAY INSERT TO PARTITIONED TABLE LOOSES ROWS DUE TO CONCURRENT DDL (ORA-14403)

9488887 – FORIEGN KEY VIOLATION WITH ARRAY-INSERT AND ONLINE IDX REBUILD AFTER BUG-9255542

Flashback Database

8834425 – ORA-240 IN RVWR PROCESS CAUSING 5MIN TRANSACTIONAL HANG

PLSQL

9210925 – AFTER MANUAL UPGRADE TO 11.1.0.7 PL/SQL CALLS INCORRECT FUNCTION

Automatic Memory Management

8505803 – PRE_PAGE_SGA RESULTS IN EXCESSIVE PAGE TABLE SIZE WHEN USING MEMORY_TARGET [AMM]

Partitioning

9165206 – PARTITIONING ORA-600 [KKPOLLS1] / [KKDOILSF1] – DURING PARTITION MAINTANANCE

Real Application Cluster

8875671 – LX64: ORA-600 ARGS [KJPNP_CHK:!MASTER_READY],

9093300 – LOTS OF REPEATED KJXOCDR: DROP DUPLICATE OPEN MESSAGE IN LMD TRACE

Row Access Method

8544696 – TABLE GROWTH – BLOCKS ARE NOT REUSED

Streams

8650719 – DOWNSTREAM CAPTURE ABORTS WITH ORA-26766

Secure Files

8856478 – RAM SECUREFILE PERF DEGRADATION WITH SF COMPRESSION ON SMALL LOBS DURING ATB MOVE

9272086 – STBH: DATA PUMP WRITER SEEMS TO BE WAITING ON WAIT FOR UNREAD MESSAGE ON BROADCA

DB Recovery

8909984 – APPSST GSI 11G: GAPS IN AWR SNAPSHOTS

9068088 – MEDIA RECOVERY WAS HUNG ON STANDBY

9145541 – ORA-600 [25027] / ORA-600 [4097] FOR ACTIVE TX IN A PLUGGED TABLESPACE

9167285 – PKT-BUGOLTP: ORA-07445: [KCRALC()+87]

Space Management

7519406 – ‘J000’ TRACE FILE REGARDING GATHER_STATS_JOB INTERMITTENTLY SINCE 10.2.0.4

8815639 – [11GR2-LNX-090813] MULTIPLE INSERT CAUSE DATA ALLOCATION ABOVE HHWM

9216806 – HIGH “ENQ: TS – CONTENTION” FOR TEMPORARY SEGMENT WHILE SQLLDR DIRECT PATH LOAD

9242411 – STRESS-BIGBH: LOTS OF OR-3113S IN BIGBH STRESS TEST

9461782 – ORA-7445 [KTSLF_SUMFSG()+54] [SIGSEGV] AND KTSLFSUM_CFS ON CALL STACK

Compression

9011088 – [11GR2]ADDING COLUMN TO COMPRESSED TABLE, DATA LOSS OCCURED.

9275072 – APPSST GSI 11G : BUFFER BUSY WAITS INSERTING INTO TABLES

9341448 – APPSST GSI 11G : BUFFER BUSY WAITS AND LATCH: CACHE BUFFERS WAITS WHEN INSERTING

9637033 – ORA-07445[KDR9IR2RST0] INSERT AS SELECT IN A COMPRESSED TABLE WITH > 255 COLUMNS

SQL Execution

8664189 – ORA-00600 [KDISS_UNCOMPRESS: BUFFER LENGTH]

9119194 – PSRC: DISTRIBUTED QUERY SLOWER IN 10.2.0.4 COMPARED TO 10.2.0.3

Transaction Management

8268775 – PERF: HIGH US ENQUEUE CONTENTION DURING A LOGIN STORM OR SESSION FAILOVER

8803762 – ORA-00600 [KDSGRP1] BLOCK CORRUPTION ON 11G DATABASE UPGRADE

Memory Management

8431487 – INSTANCE CRASH ORA-07445 [KGGHSTFEL()+192] ORA-07445[KGGHSTMAP()+241]

Message

9713537 – ENHANCE CAUSE/ACTION FIELDS OF THE INTERNAL ERROR ORA-00600

9714832 – ENHANCE CAUSE/ACTION FIELDS OF THE INTERNAL ERROR ORA-07445

沪ICP备14014813号-2

沪公网安备 31010802001379号