Connection pool,sqlnet,listener related issues/questions

Advise required on inbound paramters , prespawn servers and db resident connection

Question:

The application does not support persistent connection. currently we find time out errors. In order to fix the issue we seek your advise on the following:
currently all of the following are default values
SQLNET.INBOUND_CONNECT_TIMEOUT, — can we make it 10 seconds ? or what value you suggest

SQLNET.SEND_TIMEOUT, SQLNET.RECV_TIMEOUT

INBOUND_CONNECT_TIMEOUT_listenernam — planning to make 5 seconds; what are your suggestios.

2. ours is 11.2.0.1 ; whether prspawn server is still there in 11g R2. Will it be helpful for application supporting persistent connection or not

3. Regarding DRCP for those applications not supporting persistent connection , similarly do we have any answer for applications having persistent connections but at the same time avoiding logon storms.


Answer:

Well it sounds like you need to increase the processes parameters to allow the logon storms. Or setup a connection pool from the apache side to prevent the number of connections from hitting the server to increase.

Otherwise from the server side any values you set other then increasing the processes value to handle the load will report errors to the client trying to connect.
For example if you set the INBOUND_CONNECT_TIMEOUT then the client has to authenticate in that timeframe or it will error and report the 3136 error. But that defaults to 60 seconds to prevent any good connections from being booted just for being slow.

Now if you hit the processes value it will start reporting the 12518 and should trigger a connection error so apache should stop trying to force the connections at that point. If it continues then it will get errors and there is not much you can do. From the Oracle side you cannot really control how the client connects. If they cause a storm you either configure to handle the load or accept the fact the system will generate errors and not service the storm.
From the server side most of the parameters we have are to limit or control the amount of connections that are allowed to the server itself. If the client keeps trying to connect in a storm fashion there is not much you can do to prevent it on the DB you simply need to make it possible for those processes to connect.

the only real option from the server is to bump up the processes parameter to make sure you can handle the full load and have them setup a connection pool on the apache side to limit the total number of connections to the database from the web server to prevent them from hitting the processes value.
Connection pool , sqlnet, listener related issues/questions

Oracle网络TNS协议介绍(revised)

在开发源工具解决Oracle中的问题时,必须了解TNS协议。在努力理解TNS协议的时候,Oracle JDBC驱动程序(classes12.zip)会是一个很有用的资源

TNS头

每个TNS包都有一个8字节的包头。包最前面的两个字节用来表示包的长度–不包括包头的大小。和所有的值一样,大小是大端字节的方式存储的。如果进行了校验,那么校验和会被存放在下一个字(WORD)内–默认情况下会对校验和进行校验,该字(WORD)的值为0x0000。下面的一个字节用来表示包的类型–例如,最常见的类型如下所示:

Connect packet Type        1
Accept packet    Type       2
Ack  packet          Type      3
Refuse Packet     Type      4
Redirect Packet    Type   5
Data   Packet         Type    6
NULL Packet          Type    7
Abort  Packet          Type   9
Resend    Packet       Type 11
Marker   Packet         Type 12
Attention Packet       Type 13
Control   Packet        Type 14

要连接Oracle的时候,在TNS级,客户机向服务器发送一个链接包(类型1),这个包会指定客户将要访问的服务器名称。假定Listener知道这样的服务,那么接下来有两种可能:Listener可能会发送一个接收包(类型2)或者它可能用一个重定向包(类型5)将客户机指定向到另一个端口。如果出现的是前一种情况,那么客户机将尝试进行身份验证。如果出现的是后一种情况,那么客户机会向自己被重定向的端口发送一个连接包并请求访问该服务。如果一切顺利的话,服务器会发出一个接收包并开始进行身份验证。所有的身份验证包都是类型为6的数据包。

如果Listener不知道客户机要求访问那个服务,那么它就会发送一个拒绝包–类型4。一旦通过身份验证,查询包和结果包都是数据包。偶尔您会看到类型为12(oxoC的包)–这是用来中断的标记包。例如,如果服务器希望客户机停止发送数据,那么它会向客户机发送一个标记包。

接下来继续介绍TNS包头的细节,下面的一个字节是包头标志位(header flag)。一般这些包头标志位是不使用的,不过在10g中客户机可能会将它的值设定为0x04。

最后的两个字节构成一个字(WORD),他用来存放头校验和–在默认情况下不使用这个字并将其设为0x000:

WORD   00 00  Pocket Size
WORD   00 00  Packet Checksum
Byte     00  Packet Type
Byte     00   Flags
Word     00 00 Header Checksum

在对包进行深入研究前,观察一下拒绝包(类型4)应该会有所帮助。拒绝包表示某种错误–例如,一个因“用户名/密码无效”而被拒绝登陆的错误–即ORA-01017。根绝这些错误,第54个字节指出了问题所在:A3代表无效的密码,a2表明没有这样的用户。很明显,即使从拒绝包中也可以得到可能有用的信息。

发现这篇文章被网友转载了:地址;而且因为163 blog的权重比这里高导致原帖变成了”转帖”,真是很令人头痛的事情,
转载请注明出处:www.askmac.cn  谢谢!

DNS设置引起的登录延迟

一套Linux上的11.1.0.7系统,操作系统管理人员最近对该服务器上的网络配置文件/etc/nsswitch.conf进行了调整,调整前其主机名解析选项为”hosts:files dns” ,调整后被修改成了”hosts:files [NOTFOUND=continue] dns”;此后应用人员尝试在该主机上使用
“sqlplus username/password@connect_string”远程登录数据库都会出现多达五分钟的延迟,使用lsnrctl status命令查看监听器状态,发现LISTENER一切正常;初步可以判断是dns解析导致了长时间的延迟。
[Read more…]

共享池中的NETWORK BUFFER

中午休闲时在itpub看到一个关于network buffer占用大量内存的求助帖,帖子原文如下:

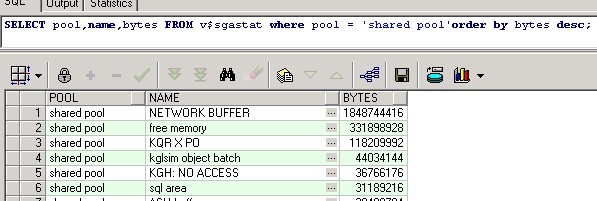
各位大侠们,请教个问题。昨天遇到一个solaris10平台下的oracle10g(10.2.0.4)数据库报共享内存不足,发现数据库的sga_target才2512M,而在v$sgastat视图中查到的
shared pool–>NETWORK BUFFER就有1848744416字节,是什么引起network buffer这么大呢,在udmp目录下1分钟产生几个跟 ORA-4031相关的文件。

==================
SQL> show parameter sga

NAME                                 TYPE        VALUE
———————————— ———– ——————————
lock_sga                             boolean     FALSE
pre_page_sga                         boolean     FALSE
sga_max_size                         big integer 2512M
sga_target                           big integer 2512M
SQL> show parameter share

NAME                                 TYPE        VALUE
———————————— ———– ——————————
hi_shared_memory_address             integer     0
max_shared_servers                   integer
shared_memory_address                integer     0
shared_pool_reserved_size            big integer 72142028
shared_pool_size                     big integer 0
shared_server_sessions               integer
shared_servers                       inte


NETWORK BUFFER对我们来说或许有些陌生,那是因为绝大多数场合都采用dedicated server模式,共享服务器模式下NETWORK BUFFER将被大量使用。MOS文档[741523.1]叙述了NETWORK BUFFER的主要用途:

On 10.2, after upgrading from 9iR2, the following error occurs:

ORA-07445: exception encountered: core dump [] [] [] [] [] []

plus

Dispatcher Trace file contains an ORA-4031 Diagnostic trace, with:
Allocation request for: NETWORK BUFFER

…followed by…

found dead dispatcher ‘D000’, pid = (12, 1)

The amount of memory used by NETWORK BUFFERs in the shared pool has significantly grown between 9.2 and 10.2.  The side-effect is to run-out of Shared Pool memory (reporting an ORA-4031), when a large number of sessions are connecting to the server (in the order of 1000’s).

While a session is being established, we allocate 3 buffers each of 32k in size.  After the session is established, we use the 3 SDU-sized buffers, however we do not deallocate the 3x32k buffer we allocated initially.

This issue has been logged in unpublished Bug 5410481.

Additionally, there is  Bug 6907529.

NS buffers are allocated based on the SDU specified by the user. The negotiated SDU could be considerably lower. The difference between these two is wasted.

For example, the dispatcher specifies an SDU of 32k. Clients, by default, use an SDU of 8k. The remaining 24k is never used.

Issue in Bug 6907529 is fixed in 11.2.

Bug 5410481 is fixed in 10.2.0.3.

As a workaround to 5410481, the ADDRESS part of DISPATCHERS parameter can be used to specify a smaller SDU size.

For example:
DISPATCHERS=”(DESCRIPTION=(ADDRESS=(PROTOCOL=tcp))(SDU=8192))”

To implement the change;

  1. connect to the database as SYSDBA
  2. alter system set dispatchers='(address=(protocol=tcp)(host=IP-Address)(sdu=8192))(dispatchers=DispatcherCount)’ scope=spfile;
  • re-start the database
  • 你可能会问SDU是什么?Oracle NET缓存的数据以SDU为基本单位,SDU即 session data unit,一般默认为8192 bytes。当这些数据单元被写满,或被client读取时,他们将被传递给Oracle Network层(oracle network layer)。譬如Data Guard环境中redo传输的每个Chunk往往要大于8192 bytes,那么默认的SDU就不太适用。当有大量重做数据要传输到standby库时,增大SDU buffer的大小可以改善Oracle的网络性能。你可以很方便的通过修改sqlnet.ora配置文件来修改SDU,如在该文件内加入以下条目:
    DEFAULT_SDU_SIZE=32767 /*修改全局默认SDU到32k*/
    当然你也可以在tnsnames.ora中定义服务别名时个别指定SDU,下文我们会用到。
    如上文所述在版本10.2.0.3以前当会话建立时,Oracle会以dispatchers参数定义的SDU为单位,分配3个单位的NETWORK  BUFFER,而实际上client端可能并未指定和dispatchers一致的SDU,若dispatchers中定义的SDU为32k,而client使用默认的8k SDU,则一个会话可能要浪费3*32-3*8=72k的NETWORK BUFFER。

    为什么共享服务器模式下会用到共享池中的NETWORK BUFFER,而独享服务器模式下没有呢?因为在独享服务器模式下每个会话所分配的三个SDU是从PGA中获取的;当使用共享服务器模式时会话与服务进程形成一对多的映射关系,这三个SDU 的NETWORK BUFFER同UGA一样转移到了SGA中。

    下面我们通过实践来进一步验证。

    SQL> select * from v$version;
    
    BANNER
    ----------------------------------------------------------------
    Oracle Database 10g Enterprise Edition Release 10.2.0.4.0 - 64bi
    PL/SQL Release 10.2.0.4.0 - Production
    CORE    10.2.0.4.0      Production
    TNS for Linux: Version 10.2.0.4.0 - Production
    NLSRTL Version 10.2.0.4.0 - Production
    /*实验服务器端采用10.2.0.4版本*/
    SQL> show parameter dispatch
    
    NAME                                 TYPE        VALUE
    ------------------------------------ ----------- ------------------------------
    dispatchers                          string      (address=(protocol=tcp)(host=1
                                                            92.168.1.103)(sdu=32768))(SERV
                                                            ICE=cXDB)(dispatchers=10)
    /*dispatchers中指定了SDU为32k*/
    
    C:\Windows\System32>tnsping cXDB
    TNS Ping Utility for 32-bit Windows: Version 11.2.0.1.0 - Production on 05-8月 -2010 22:51:27
    Copyright (c) 1997, 2010, Oracle.  All rights reserved.
    已使用的参数文件:
    D:\tools\adminstratorg\orahome\network\admin\sqlnet.ora
    已使用 TNSNAMES 适配器来解析别名
    尝试连接 (DESCRIPTION = (SDU=8192) (ADDRESS_LIST = (ADDRESS = (PROTOCOL = TCP)(HOST = 192.168.1.103)(PORT = 1521))) (CONNECT_DATA = (SERVER = SHARED) (SERVICE_NAME = cXDB)))
    OK (30 毫秒)
    /* client端采用11.2.0.1版本,定义了共享服务器模式的服务别名,显式指定SDU为8192字节*/
    

    这里我们要用到一个简单的java程序,用来模拟大量会话登录;这个程序很傻瓜,但是总比你一个个开SQLPLUS要明智的多:

    /*这是一个很简单的java程序,登录远程数据库,并尝试打开600个回话,并且都指定了SDU为8192*/
    package javaapplication2;
    import oracle.jdbc.*;
    import java.sql.*;
    public class Main
    {
        public static void main(String[] args) throws SQLException
        {
            try
            {
                Class.forName("oracle.jdbc.driver.OracleDriver");
            }
            catch(Exception e )
            {
            }
            Connection cnn1=DriverManager.getConnection("jdbc:oracle:thin:@(DESCRIPTION = (SDU=8192) (ADDRESS_LIST = (ADDRESS = (PROTOCOL = TCP)(HOST = 192.168.1.103)(PORT = 1521))) (CONNECT_DATA = (SERVER = SHARED) (SERVICE_NAME = cXDB)))", "system", "password");
            Statement stat1=cnn1.createStatement();
            ResultSet rst1=stat1.executeQuery("select * from v$version");
            while(rst1.next())
            {
                System.out.println(rst1.getString(1));
            }
            Connection m[]=new Connection[2000];
            Statement s[]=new Statement[2000];
            ResultSet r[]=new ResultSet[2000];
            int i=0;
            while(i<600)
            {
                try
                {
                    m[i]=DriverManager.getConnection("jdbc:oracle:thin:@(DESCRIPTION = (SDU=8192) (ADDRESS_LIST = (ADDRESS = (PROTOCOL = TCP)(HOST = 192.168.1.103)(PORT = 1521))) (CONNECT_DATA = (SERVER = SHARED) (SERVICE_NAME = cXDB)))", "system", "password");
                }
                catch (Exception em)
                {
                    System.out.println(em.getMessage());
                }
                try
                {
                    Thread.sleep(3);
                }
                catch (Exception e)
                {
                }
                s[i]=m[i].createStatement();
                m[i].setAutoCommit(false);
                i++;
                System.out.println(i+"is ok !");
            }
            System.out.println("We are waiting!");
            try
            {
                Thread.sleep(1000);
            }
            catch (Exception e)
            {
            }
        }
    }
    

    编译上面这段程序,尝试执行看看,执行的同时留意观察NETWORK BUFFER:

    SQL> select name,pool,bytes from v$sgastat where name like '%NETWORK%';
    
    NAME                       POOL              BYTES
    -------------------------- ------------ ----------
    NETWORK BUFFER             shared pool      328080
    
    java -jar ora_network_buffer_test_8.jar
    /*启动编译后的测试程序*/
    
    SQL> select name,pool,bytes from v$sgastat where name like '%NETWORK%';
    NAME                       POOL              BYTES
    -------------------------- ------------ ----------
    NETWORK BUFFER             shared pool    69608200
    
    SQL> select name,pool,bytes from v$sgastat where name like '%NETWORK%';
    NAME                       POOL              BYTES
    -------------------------- ------------ ----------
    NETWORK BUFFER             shared pool      348960
    /*会话终止后,NETWORK BUFFER回缩*/
    
    修改上述程序中的SDU到32k,重新编译后再次测试
    java -jar ora_network_buffer_test_32.jar
    
    SQL> select name,pool,bytes from v$sgastat where name like '%NETWORK%';
    
    NAME                       POOL              BYTES
    -------------------------- ------------ ----------
    NETWORK BUFFER             shared pool      328080
    
    SQL> select name,pool,bytes from v$sgastat where name like '%NETWORK%';
    
    NAME                       POOL              BYTES
    -------------------------- ------------ ----------
    NETWORK BUFFER             shared pool    99148576
    /*可以看到同样的会话数量,client端SDU增大到32k后,NETWORK BUFFER有了大幅增长*/
    
    我们修改dispatchers参数中的SDU到8k看看
    SQL> alter system set dispatchers='';
    
    System altered.
    
    SQL> alter system set dispatchers='(address=(protocol=tcp)(host=192.168.1.103)(sdu=8192))(SERVICE=cXDB)(dispatchers=10)';
    
    System altered.
    SQL> show parameter dispatchers
    
    NAME                                 TYPE        VALUE
    ------------------------------------ ----------- ------------------------------
    dispatchers                          string      (address=(protocol=tcp)(host=1
                                                            92.168.1.103)(sdu=8192))(SERVI
                                                            CE=cXDB)(dispatchers=10)
    SQL> select name,pool,bytes from v$sgastat where name like '%NETWORK%';
    
    NAME                       POOL              BYTES
    -------------------------- ------------ ----------
    NETWORK BUFFER             shared pool      328080
    
    java -jar ora_network_buffer_test_32.jar
    
    SQL> select name,pool,bytes from v$sgastat where name like '%NETWORK%';
    
    NAME                       POOL              BYTES
    -------------------------- ------------ ----------
    NETWORK BUFFER             shared pool    99148552
    /*看起来dispatcher中的SDU优先级并没有client中的高*/
    我们再来看看client中SDU为8k的情况
    SQL> show parameter dispatchers
    
    NAME                                 TYPE        VALUE
    ------------------------------------ ----------- ------------------------------
    dispatchers                          string      (address=(protocol=tcp)(host=1
                                                            92.168.1.103)(sdu=8192))(SERVI
                                                            CE=cXDB)(dispatchers=10)
    SQL> select name,pool,bytes from v$sgastat where name like '%NETWORK%';
    
    NAME                       POOL              BYTES
    -------------------------- ------------ ----------
    NETWORK BUFFER             shared pool      328080
    
    java -jar ora_network_buffer_test_8.jar
    
    SQL> select name,pool,bytes from v$sgastat where name like '%NETWORK%';
    NAME                       POOL              BYTES
    -------------------------- ------------ ----------
    NETWORK BUFFER             shared pool    69608200
    /*与dispatchers中为32k,而client为8k时一样*/
    

    由以上实践可知10.2.0.4之后,NETWORK BUFFER的使用量由客户端设定的SDU和共享服务器会话数决定。我在之前的博文中曾经列出过TNS协议的几个基础类描述(见《Oracle 网络TNS协议的几个基础类描述》),其中Session包含了setSDU(int i)方法,其代码如下:

    public void setSDU(int i)
    {
    if(i <= 0) sdu = 2048;
    else if(i > 32767)
    sdu = 32767;
    else if(i < 512)
    sdu = 512;
    else
    sdu = i;
    }
    

    由以上代码可知,客户端设定的SDU时,其最大最小值分别为32k和512bytes,大于32k时被强制设为32k,而小于512bytes时被强制设为512bytes,若设定SDU<0,则被强制修正为2048 bytes,在512 bytes- 32767 bytes之间则为原值不变。

    SQL*Net break/reset to client等待事件

    一般情况下无法从动态视图(v$session/v$session_wait)看到这个等待事件,因为它十分短暂。其本质从字面意思上来解释的话,是一种网络等待(network issue);
    举例而言,如果运行的代码中包含某种可能的错误,且在调用中触发了的话,服务器端本地的服务进程有义务对远程客户端告知该信息,这个告知的过程中服务进程就处于SQL*Net break/reset to client等待中,直到客户端收到问题信息为止。与一般意义上的Sever-client模式一样,使用dblink时也可能出现该种等待事件。
    下面我们来尝试演示该种等待事件:

    SQL>  create table tv (t1 int unique);
    
    Table created.
    
    SQL> insert into tv values(1);
    
    1 row created.
    
    SQL> commit;
    
    Commit complete.
    
    SQL> oradebug setmypid;
    Statement processed.
    SQL>  oradebug event 10046 trace name context forever,level 8;
    Statement processed.
    SQL> insert into tv values(1);
    insert into tv values(1)
    *
    ERROR at line 1:
    ORA-00001: unique constraint (SYS.SYS_C009343) violated
    
    SQL>  oradebug event 10046 trace name context off;
    Statement processed.
    SQL> select event, total_waits from v$session_event where event like '%break%' and sid =(select distinct sid from v$mystat);
    
    EVENT                                                            TOTAL_WAITS
    ---------------------------------------------------------------- -----------
    SQL*Net break/reset to client                                              2
    

    可以看到出现了2次SQL*Net break/reset to client ,进一步分析trace文件可以发现以下记录:

    EXEC #2:c=8000,e=9020,p=0,cr=10,cu=9,mis=0,r=0,dep=0,og=1,plh=0,tim=1279117896316991
    ERROR #2:err=1 tim=1279117896317039
    STAT #2 id=1 cnt=0 pid=0 pos=1 obj=0 op='LOAD TABLE CONVENTIONAL  (cr=0 pr=0 pw=0 time=0 us)'
    WAIT #2: nam='SQL*Net break/reset to client' ela= 33 driver id=1413697536 break?=1 p3=0 obj#=-1 tim=1279117896317323
    WAIT #2: nam='SQL*Net break/reset to client' ela= 521 driver id=1413697536 break?=0 p3=0 obj#=-1 tim=1279117896317915
    WAIT #2: nam='SQL*Net message to client' ela= 5 driver id=1413697536 #bytes=1 p3=0 obj#=-1 tim=1279117896317964
    

    2次SQL*Net break/reset to client分别为33us和521us; 设计不良的应用程序或者程序中存在较多未安置的exception都可能导致SQL*Net break/reset to client等待事件。

    single-task message and cursor pin S on X

    Recently i find many session are waiting for Event <cursor pin s on x> in my customer’s AIX 10.2.0.4 instance, it’s a new event in the 10gr2,after mutex take  place of latch .

    When a session is going to parse or reparse one cursor, need to pin X this cursor first. Then the others who what to execute this child cursor  have to wait until pin X released.

    I looked for the session who was pining that cursor on  X mode ,and saw it was waiting on event single-task messag:
    the mutex idn is d322e445,and operated in EXCL mode; It correspond to the cursor whose hash is “ff2c2fd459ac5ee188586781d322e445” as after:

    PROCESS 1753:
    ----------------------------------------
    SO: 70000048e9d5e68, type: 2, owner: 0, flag: INIT/-/-/0x00
    (process) Oracle pid=1753, calls cur/top: 70000043308cb08/70000043798a6e0, flag: (0) -
    int error: 0, call error: 0, sess error: 0, txn error 0
    (post info) last post received: 109 0 4
    last post received-location: kslpsr
    last process to post me: 70000048f8deaf0 1 6
    last post sent: 0 0 24
    last post sent-location: ksasnd
    last process posted by me: 70000048f8deaf0 1 6
    (latch info) wait_event=0 bits=0
    Process Group: DEFAULT, pseudo proc: 70000048ca877c0
    O/S info: user: orauser, term: UNKNOWN, ospid: 3318124
    OSD pid info: Unix process pid: 3318124, image: oracle@p595crm1
    .........................
    ----------------------------------------
    SO: 70000048eed0d30, type: 4, owner: 70000048e9d5e68, flag: INIT/-/-/0x00
    (session) sid: 3311 trans: 70000046be86948, creator: 70000048e9d5e68, flag: (100041) USR/- BSY/-/-/-/-/-
    DID: 0001-06D9-008347C7, short-term DID: 0001-06D9-008347C8
    txn branch: 70000046a261488
    oct: 3, prv: 0, sql: 700000414e4f570, psql: 700000415f47a90, user: 50/SHUCRM1C
    service name: CRMDB1
    O/S info: user: pausr12, term: unknown, ospid: 1234, machine: p570web2
    program: JDBC Thin Client
    application name: JDBC Thin Client, hash value=2546894660
    waiting for 'single-task message' blocking sess=0x0 seq=22963 wait_time=0 seconds since wait started=6
    =0, =0, =0
    Dumping Session Wait History
    for 'SQL*Net message from dblink' count=1 wait_time=325
    driver id=54435000, #bytes=1, =0
    for 'SQL*Net message to dblink' count=1 wait_time=2
    driver id=54435000, #bytes=1, =0
    for 'SQL*Net message from dblink' count=1 wait_time=383
    driver id=54435000, #bytes=1, =0
    for 'SQL*Net message to dblink' count=1 wait_time=1
    driver id=54435000, #bytes=1, =0
    for 'SQL*Net message from dblink' count=1 wait_time=265
    driver id=54435000, #bytes=1, =0
    for 'SQL*Net message to dblink' count=1 wait_time=2
    driver id=54435000, #bytes=1, =0
    for 'SQL*Net message from dblink' count=1 wait_time=677
    driver id=54435000, #bytes=1, =0
    for 'SQL*Net message to dblink' count=1 wait_time=0
    driver id=54435000, #bytes=1, =0
    for 'SQL*Net message from dblink' count=1 wait_time=237
    driver id=54435000, #bytes=1, =0
    for 'SQL*Net message to dblink' count=1 wait_time=1
    driver id=54435000, #bytes=1, =0
    temporary object counter: 0
    SO:  70000043e695968, type: 53, owner: 70000048eed0d30, flag: INIT/-/-/0x00
    LIBRARY OBJECT LOCK: lock=70000043e695968 handle=700000410dd46c8 mode=N                           --the child cursor
    call pin=0 session pin=0 hpc=0000 hlc=0000
    htl=70000043e6959e8[70000041e9eb830,70000042411c178] htb=70000042411c178  ssga=70000042411bc10
    user=70000048eed0d30 session=70000048eed0d30 count=1 flags=CBK[0020]  savepoint=0x0
    LIBRARY OBJECT HANDLE: handle=700000410dd46c8 mtx=700000410dd47f8(0)  cdp=0
    namespace=CRSR flags=RON/KGHP/PN0/EXP/[10010100]
    kkkk-dddd-llll=0000-0001-0001  lock=N pin=X latch#=23 hpc=fffc  hlc=fffc                                     --lock  in NULL mode,pin on X mode
    lwt=700000410dd4770[700000410dd4770,700000410dd4770]  ltm=700000410dd4780[700000445169a08,700000453b69228]
    pwt=700000410dd4738[700000410dd4738,700000410dd4738]  ptm=700000410dd4748[700000410dd4748,700000410dd4748]
    ref=700000410dd47a0[70000043d1b5e58,70000043d1b5e58]  lnd=700000410dd47b8[700000410dd47b8,700000410dd47b8]
    LIBRARY OBJECT: object=7000004354983b0
    type=CRSR flags=EXS[0001] pflags=[0000] status=VALD load=0
    DEPENDENCIES: count=4 size=16
    TRANSLATIONS: count=2 size=16
    DATA BLOCKS:
    data#     heap  pointer    status pins change whr
    ----- -------- -------- --------- ---- ------ ---
    0 7000004359e4768 7000004354984c8 I/P/A/-/-    0 NONE   00
    6 700000414b0e4d0 700000450c0bc28 I/P/A/-/E    0 NONE   00
    
    ----------------------------------------
    
    KGX Atomic  Operation Log 70000041853c068
    Mutex 700000414b0e3d8(3311, 0) idn d322e445 oper EXCL
    Cursor Pin uid 3311 efd 0 whr 1 slp  0      -- pin sid 3311
    opr=3 pso=70000043e695968  flg=0            -- operate code is 3
    pcs=700000414b0e3d8 nxt=0 flg=35 cld=0 hd=700000410dd46c8   par=70000041d78b1e0    -- child cursor handle address is 700000410dd46c8
    ct=0 hsh=0 unp=0 unn=0 hvl=1d78b4b8 nhv=1  ses=70000048eed0d30                              -- heap 0 pointer address 70000041d78b1e0
    hep=700000414b0e458 flg=80 ld=1 ob=7000004354983b0 ptr=700000450c0bc28  fex=700000450c0af38
    ----------------------------------------
    SO: 70000041e9eb7b0, type: 53, owner: 70000048eed0d30, flag:  INIT/-/-/0x00
    LIBRARY OBJECT LOCK: lock=70000041e9eb7b0 handle=700000414e4f570 mode=N
    call pin=0 session pin=0 hpc=0000 hlc=0000
    htl=70000041e9eb830[70000044590d030,70000043e6959e8] htb=70000042411c178  ssga=70000042411bc10
    user=70000048eed0d30 session=70000048eed0d30 count=1 flags=[0000]  savepoint=0x4c08a856
    LIBRARY OBJECT HANDLE: handle=700000414e4f570 mtx=700000414e4f6a0(0)  cdp=1
    name=
    SELECT * FROM(SELECT A.*, rownum r FROM( select  account_id,billing_nbr,calling_nbr,called_nbr,to_date,call_duration,charge_item_name,to_char(rate  /100, '99999999999990.99') rate, charge,channel_id from ct_05
    where  1=1 and account_id ='300187744'  and key_source_type ='52001'  order by to_date ) A WHERE rownum <= 15 ) B WHERE r > 0
    hash=ff2c2fd459ac5ee188586781d322e445 timestamp=06-04-2010 15:14:33
    namespace=CRSR flags=RON/KGHP/TIM/PN0/MED/DBN/[50010040]
    kkkk-dddd-llll=0000-0001-0001 lock=N pin=0 latch#=23 hpc=0018 hlc=0018
    lwt=700000414e4f618[700000414e4f618,700000414e4f618]  ltm=700000414e4f628[700000414e4f628,700000414e4f628]
    pwt=700000414e4f5e0[700000414e4f5e0,700000414e4f5e0]  ptm=700000414e4f5f0[700000414e4f5f0,700000414e4f5f0]
    ref=700000414e4f648[700000414e4f648,700000414e4f648]  lnd=700000414e4f660[700000414e4f660,700000414e4f660]
    LIBRARY OBJECT: object=70000041d78b0c8
    type=CRSR flags=EXS[0001] pflags=[0000] status=VALD load=0
    CHILDREN: size=16
    child#    table reference   handle
    ------ -------- --------- --------
    0 70000043d1b61e8 70000043d1b5e58 700000410dd46c8                                 -- the child cursor
    DATA BLOCKS:
    data#     heap  pointer    status pins change whr
    ----- -------- -------- --------- ---- ------ ---
    0 7000004467f6078 70000041d78b1e0  I/P/A/-/-    0 NONE   00                                      --  heap 0

    The session is active,and its wait history indicates there are some dblink operation inside the running SQL, When this session waited to reparse the only child cursor for that SQL , it pin this child cursor in X mode first,and then it need more information from remote DB , but no response until SQL*NET MESSAGE from DBLINK timeout,it was waiting single-task message for more than 6 seconds when tracing.

    In this scenario other sessions who wait to execute this child cursor were all waiting , so sadly.

    The oracle document describes <single-task message> as When running single task, this event indicates that the session waits for the client side of the executable.

    A little odd,the blocked also did some single task when it lost one dblink connection.

    I searched the metalink with keyword: single-task message, there were few documents  found , but fortunately below note:

    Hdr: 7757687 10.2.0.3.0 RDBMS 10.2.0.3.0 PRG INT/DISTR PRODID-5 PORTID-212
    Abstract: CURSOR: PIN S WAIT ON X BLOCKER “SINGLE-TASK MESSAGE”

    PROBLEM:
    ——–
    The databse has multiple processes waiting on “CURSOR: PIN S WAIT ON X”

    The holder of the mutes is waiitng on “single-task message” form almost
    745687
    seconds.
    The query run by the holder  does conatin a dblink.

    DIAGNOSTIC ANALYSIS:
    ——————–
    All the  process waiting on the same mutex:-

    waiting for ‘cursor: pin S wait on X’ blocking sess=0x0
    idn=5d779f21, value=7af00000000, where|sleeps=57a0dfdb6

    Holder
    PROCESS 26:
    KGX Atomic Operation Log 700000061490300
    Mutex 70000006226e0f0(1967, 0) idn 5d779f21 oper EXCL
    Cursor Pin uid 1967 efd 0 whr 1 slp 0
    opr=3 pso=7000000670f93a0 flg=0
    pcs=70000006226e0f0 nxt=0 flg=35 cld=0 hd=7000000606838f0
    par=7000000629006a8
    ct=0 hsh=0 unp=0 unn=0 hvl=62900980 nhv=1 ses=700000079543fe0
    hep=70000006226e170 flg=80 ld=1 ob=700000062fe69a8
    ptr=700000065f124f8 fex=700000065f11808

    Session object for this process:-

    SO: 700000079543fe0, type: 4, owner: 70000007a6ad538, flag: INIT/-/-/0x00
    (session) sid: 1967 trans: 0, creator: 70000007a6ad538, flag: (41)
    USR/- BSY/-/-/-/-/-
    DID: 0001-001A-00000A38, short-term DID: 0001-001A-00000A39
    txn branch: 0
    oct: 3, prv: 0, sql: 700000062900e18, psql:
    70000005d797bc8, user: 21/V500
    O/S info: user: d_c11, term: , ospid: 6271140, machine: aruput5
    program: cpm_srvscript@aruput5 (TNS V1-V3)
    application name: cpm_srvscript@aruput5 (TNS V1-V3), hash value=0
    waiting for ‘single-task message’ blocking sess=0x0 seq=7071
    wait_time=0 seconds since wait
    started=745687

    This bug which occurs on Version 10.2.0.3 is so similar to my case on AIX version 10.2.0.4, so as the stack trace:

    ksdxfstk+002c<-ksdxcb+04e4<-sspuser+0074<-000044C0<-nttrd+0120<-nsprecv+07a0<-
    nscon+0218<-nsdo+157c<-nscall3+012c<-nscall+0778<-niotns+0888<-nigcall+0028<-osnco
    n+0540<-kpkiadef+006c<-upiini+03fc<-upiah0+00ac<-kpuatch+0808<-OCIServerAttach+011
    4<-kpnconn+02a4<-npicon0+042c<-kpndbcon+0630<-OCIKDBLinkConn2+0038<-OCIKDBLinkConn
    +002c<-ddfnet2Normal+011c<-kkmfcbrm+009c<-kkmpfcbk+02a0<-qcsprfro+0538<-qcsprfro_tree
    +0318<-qcsprfro_tree+01c8<-qcspafq+0068<-qcspqb+0470<-kkmdrv+003c<-opiSem+13b4<-opiDe
    ferredSem+0234<-opitca+01e8<-kksFullTypeCheck+001c<-rpiswu2+034c<-kksLoadChild+30b0<-
    kxsGetRuntimeLock+0810<-kksfbc+2930<-kkspsc0+0ffc<-kksParseCursor+00d4<-opiosq0+0b30<
    -kpooprx+0168<-kpoal8+0400<-opiodr+0adc<-ttcpip+1020<-opitsk+10b0<-opiino+0990<-opiod
    r+0adc<-opidrv+0474<-sou2o+0090<-opimai_real+01bc<-main+0098<-__start+0098

    My case stack trace:
    ksdxfstk+002c<-ksdxcb+04e4<-sspuser+0074<-000044C0<-nttcni+01b8<-nttcon+04f4<-ntconn+0160<
    -nsopen+0960<-nscall1+01b0<-nscall+049c<-niotns+0880<-nigcall+0028<-osncon+0540<-kpkiadef+006c<
    -upiini+0408<-upiah0+00ac<-kpuatch+0808<-OCIServerAttach+0114<-kpnconn+02a4<-npicon0+042c<
    -kpndbcon+0630<-OCIKDBLinkConn2+0038<-OCIKDBLinkConn+002c<-ddfnet2Normal+011c<-kkmfcbrm+009c<
    -kkmpfcbk+02a0<-qcsprfro+0538<-qcsprfro_tree+03f0<-qcsprfro_tree+0228<-qcspafq+0068<
    -qcspqbDescendents+03a0<-qcspqb+00ac<-qcsevw+02e0<-kkmevw+0a58<-kkmfcbvw+0178<
    -kkmfcblo+0e38<-kkmpfcbk+0250<-qcsprfro+0538<-qcsprfro_tree+03f0<-qcsprfro_tree+0228<
    -qcspafq+0068<-qcspqbDescendents+03a0<-qcspqb+00ac<-qcsevw+02e0<-qcsfpsq+003c<
    -kkmfcbsq+01e8<-kkmpfcbk+0260<-qcsprfro+0538<-qcsprfro_tree+03f0<-qcsprfro_tree+0228<
    -qcspafq+0068<-qcspqbDescendents+03a0<-qcspqb+00ac<-qcsevw+02e0<-qcsfpsq+003c<
    -kkmfcbsq+01e8<-kkmpfcbk+0260<-qcsprfro+0538<-qcsprfro_tree+03f0<-qcsprfro_tree+0228<
    -qcspafq+0068<-qcspqbDescendents+03a0<-qcspqb+00ac<-kkmdrv+003c<-opiSem+13c0<
    -opiprs+01ac<-kksParseChildCursor+05e0<-rpiswu2+034c<-kksLoadChild+1d88<
    -kxsGetRuntimeLock+0810<-kksfbc+28b0<-kkspsc0+0ffc<-kksParseCursor+00d4<-opiosq0+0ae0<
    -kpooprx+0168<-kpoal8+0400<-opiodr+0ae0<-ttcpip+1020<-opitsk+1124<-opiino+0990<-opiodr+0ae0<
    -opidrv+0484<-sou2o+0090<-opimai_real+01bc<-main+0098<-__start+0098

    Both of them have called OCIKDBLinkConn->OCIKDBLinkConn2->kpndbcon->npicon0->kpnconn->OCIServerAttach->kpuatch and follow.
    Till now this bug has no patch to apply or workaround way what’s awful.

    As “Bug 5111335: STREAMS PROPAGATION STUCK ON “SINGLE-TASK MESSAGE” PRODUCE LIBRARY CACHE LOCK CO” described:

    Hdr: 5111335 10.2.0.2 RDBMS 10.2.0.2 STREAMS PRODID-5 PORTID-226
    Abstract: STREAMS PROPAGATION STUCK ON “SINGLE-TASK MESSAGE” PRODUCE LIBRARY CACHE LOCK CO
    This is a three cluster environment. Two nodes per cluster and on that
    cluster running RAC with 2 instances.
    The databases involved are:

    GCTGCMU is the “GCT” database in GCM = Greenwich USA, will be named USA from
    now on
    GCTHKGU is the “GCT” database in HKG = Hong Kong, will be named HKG from now
    on
    GCTLONU is the “GCT” database in LON = London, will be named LON from now on

    On this environment there is a Streams bi-directional replication environment
    defined between the 3 databases.

    USA database is propagating changes captured to LON and HKG.
    There are two propagations defined from this site to every site. 4
    propagations as a total.

    GCTHKGU_BATCH_PROPAGATE
    GCTLONU_BATCH_PROPAGATE
    GCTHKGU_DAILY_PROPAGATE
    GCTLONU_DAILY_PROPAGATE

    Daily propagation propagates changes stored on streams queue
    STRMADMIN.STREAMSOUT_DAILY.
    Batch propagation propagates changes stored on streams queue
    STRMADMIN.STREAMSOUT_BATCH

    This databases have been upgraded to 10.2.0.2 from 10.2.0.1 last 13-Mar-2006,
    and no problems were reported.

    Customer reported that he could see that propagations from USA to HKG were
    stucked on library cache lock.
    This situation was solved by customer by bouncing USA instances.

    Analyzing the systemstate dumps we could see that there were propagations
    locked on this situation and QMON slaves too.
    The library cache lock was on the queue STRMADMIN.STREAMSOUT_DAILY and the
    owner of the lock was process J000 that was stucked ‘single-task message’.

    From the information on the systemstate dump we can see that this process has
    been on that situation for more than 3 days and 20 hours.
    Based on the call stack it seems that the process was about or in the middle
    of a call to a listener.

    DIAGNOSTIC ANALYSIS:
    ——————–
    Files to be uploaded:

    USA:
    – RDA.zip , RDA node 1
    – GCTGCMU1_healthchk.html, streams healthcheck node 1
    – GCTGCMU1_healthchk.html, streams healthcheck node 2
    – gctgcmu2_ora_21349.trc, hanganalyze and systemstate dumps when the hang is
    ocurring. Node 2
    – gctgcmu1_ora_858.trc, hanganalyze and systemstate dumps when the hang is
    ocurring. Node 1.

    HKG:
    – alert_GCTHKGU1.log, alert log file node 1
    – alert_GCTHKGU2.log, alert log file node 2
    – listener_hkg0223xus.log_20060320, listener log file node 1.
    – listener_hkg0224xus.log_20060319, listener log file node 2.

    LON:
    – alert_GCTLONU1.log, alert log file node 1
    – alert_GCTLONU2.log, alert log file node 2
    – listener_lon0223xus.log_20060318, listener log file node 1.
    – listener_lon3166xus.log_20060320, listener log file node 2.

    Hang was identified at USA on node 1.

    Analysis of gctgcmu1_ora_858.trc:

    System State 1
    ~~~~~~~~~~~~~~
    21: waiting for ‘library cache lock’ [LOCK: handle=25ea4afc8] seq=21
    42: waiting for ‘library cache lock’ [LOCK: handle=25ea4afc8] seq=404
    51: waiting for ‘library cache lock’ [LOCK: handle=25ea4afc8] seq=17
    67: waiting for ‘library cache lock’ [LOCK: handle=25ea4afc8] seq=90
    71: waiting for ‘library cache lock’ [LOCK: handle=25ea4afc8] seq=56
    76: waiting for ‘library cache lock’ [LOCK: handle=25ea4afc8] seq=344
    Cmd: PL/SQL Execute
    77: waiting for ‘library cache lock’ [LOCK: handle=25ea4afc8] seq=87

    System State 2
    ~~~~~~~~~~~~~~
    21: waiting for ‘library cache lock’ [LOCK: handle=25ea4afc8] seq=21
    42: waiting for ‘library cache lock’ [LOCK: handle=25ea4afc8] seq=404
    51: waiting for ‘library cache lock’ [LOCK: handle=25ea4afc8] seq=17
    67: waiting for ‘library cache lock’ [LOCK: handle=25ea4afc8] seq=90
    71: waiting for ‘library cache lock’ [LOCK: handle=25ea4afc8] seq=56
    76: waiting for ‘library cache lock’ [LOCK: handle=25ea4afc8] seq=344
    Cmd: PL/SQL Execute
    77: waiting for ‘library cache lock’ [LOCK: handle=25ea4afc8] seq=87

    LOCK: handle=25ea4afc8 QUEU:STRMADMIN.STREAMSOUT_DAILY

    Resource Holder State
    LOCK: handle=25ea4afc8 50: waiting for ‘single-task message’

    PROCESS 50:
    ~~~~~~~~~~~

    OSD pid info: Unix process pid: 12949, image: oracle@slodb001 (J000)

    From the call stack looks like process was doing an SQL*Net connection to a
    listenerand doing this
    connection we get hanged because the stack trace is the same for the two
    process dumps shown on
    both system states.

    (session)
    oct: 0, prv: 0, sql: (nil), psql: (nil), user: 92/STRMADMIN
    waiting for ‘single-task message’ blocking sess=0x(nil) seq=5 wait_time=0
    seconds since wait
    started=332308
    =0, =0, =0

    It is running a propagation job: next_date :=
    sys.dbms_aqadm.aq$_propaq(job);

    Knowing that the seconds in wait are 332308 and the dump of the process
    occurred on 2006-03-21 08:15:12.640,
    this process is waiting on this event:

    1. On USA the process is waiting since 17-MAR-2006 11:56:44
    2. That time on London is 17-MAR-2006 16:56:44
    3. That time on HONG KONG is 18-MAR-2006 01:56:44

    At that time nothing relevant was found on alert log files on listener log
    files.

    Processes waiting on library cache lock
    ~~~~~~~~~~~~~~~

    21 (PZ99) : Slave of J002
    42 (q004) : Slave of process 44 (QMNC)
    51 (J001) :
    67 (q003) : Slave of process 44 (QMNC)
    71 (q005) : Slave of process 44 (QMNC)
    51 (TNS shadow) :
    77 (q007) : Slave of process 44 (QMNC)

    WORKAROUND:
    ———–
    No workaround found so far.
    Killing the process or bouncing instance should solve the problem.

    RELATED BUGS:
    ————-
    No similar bugs found.

    This environment is also involved on bug 5089630

    REPRODUCIBILITY:
    —————-
    Problem has reproduced just one time on customer site.

    TEST CASE:
    ———-

    STACK TRACE:
    ————
    For processes waiting on library cache lock we can see different call stacks,
    here is the one for process 21:

    ksdxfstk ksdxcb sspuser pthread_sighandler_rt GI___libc_sigaction GI___poll
    kslwait kjusuc ksipgetctx kqlmli kgllkal kglget
    kglgob kwqicgob kwqicrqo0 kwqmsnrmsg kwqsldqs kwqsif
    qerfxFetch qervwFetch qertqoFetch qerpxSlaveFetch qerpxFetch
    opiexe kpoal8 opiodr kpoodr upirtrc kpurcsc kpuexecv8 kpuexec OCIStmtExecute

    kxfxsStmtExecute kxfxsExecute kxfxsp kxfxmai kxfprdp opirip opidrv sou2o
    opimai_real main __libc_start_main _start

    For process waiting on single-task message, we can see the following call
    stack:

    ksdxfstk ksdxcb sspuser pthread_sighandler_rt GI___libc_sigaction GI___poll
    clntudp_call do_ypcall yp_match internal_gethostbyname2_r
    nss_nis_gethostbyname_r
    gethostbyname_r
    gethostbyname snlpcgthstbynm snlinGetAddrInfo nttbnd2addr ntacbbnd2addr
    ntacbnd2addr
    nsc2addr nscall1 nscall niotns nigcall osncon
    kpkiadef upiini upiah0 kpuatch OCIServerAttach kpnconn
    npicon0 kpndbcon OCIKDBLinkConn2 OCIKDBLinkConn kwqpcon kwqpgps
    spefmccallstd pextproc peftrusted psdexsp rpiswu2 psdextp pefccal pefca
    pevm_FCAL pfrinstr_FCAL pfrrun_no_tool pfrrun plsql_run peicnt kkxexe opiexe
    opiodr rpidrus skgmstack rpidru rpiswu2 rpidrv rpiexe kkjex1e kkjsexe kkjrdp

    opirip opidrv sou2o opimai_real main libc_start_main start

    I do not see any Oracle bug here but it is hard to be
    certain without the SQLNET.ORA settings and multiple
    snapshots of the problem process. It is quite valid
    for an Oracle session to be holding a library cache lock
    when it makes an outbound DBlink call. If another session
    wants that lock in an incompatible mode then it has to wait.

    In this case the blocking session making the outbound link
    call appears from the one stack dump to be in OS code
    under gethostbyname().
    However it could have been spinning down the stack in
    Oracle code but I cannot comment on the info we have.

    The “single-task message” wait event is started / ended
    in kpnconn() so if there was a “spin” it would have to be
    above that point in the stack.

    In 10.2 there is the option to configure NET to timeout
    on outbound connect attempts by setting
    SQLNET.OUTBOUND_CONNECT_TIMEOUT = N seconds.
    The timeout occurs in niotns() in the stack so if this
    is set you would expect a session in this state to then
    timeout which may be useful if there are underlying issues with
    TCP hostname resolution.
    (Watch out for bug 4933023 if you use this SQLNET parameter).

    If the issue recurs then get CPU usage info, multiple stacks
    and you may want to attach with gdb and see if the code ever
    returns above gethostbyname or not to get an idea if this

    Sorry , my explanation is probably not clear .

    Here is the stack you have but annotated:

    Callback to get the short stack. Confirms we are not HUNG in a device
    driver.
    ksdxfstk
    ksdxcb
    sspuser
    pthread_sighandler_rt
    GI___libc_sigaction

    Inside OS supplied code executing gethostbyname() C call.
    GI___poll
    clntudp_call
    do_ypcall
    yp_match
    internal_gethostbyname2_r
    nss_nis_gethostbyname_r
    gethostbyname_r
    gethostbyname

    Oracle Net code:
    snlpcgthstbynm
    snlinGetAddrInfo
    nttbnd2addr
    ntacbbnd2addr
    ntacbnd2addr
    nsc2addr
    nscall1
    nscall
    niotns <<< This is where SQLNET.OUTBOUND_CONNECT_TIMEOUT
    is implemented IF it has been configured.
    nigcall

    Oracle RDBMS code:
    osncon
    kpkiadef
    upiini
    upiah0
    kpuatch
    OCIServerAttach
    kpnconn <<< This is where “single-task message” starts/ends
    npicon0

    If we just get two stack snapshots of the process, as was the case, and
    both have the above stack then we can say:
    As the “seq=” of both snaps is the same (5) then we did not return
    below kpnconn() in the call stack.

    But as poll() is typically a blocking call, even if only for a short
    time, then we cannot be sure if this process was blocked permanently
    in the poll() waiting on some large timout or similar, or if the
    code was executing and looping. If it was looping it could have done so
    at any point on the above stack down to kpnconn() where we would have
    changed the seq# on the wait event if we exited here.

    We can say that as the short stack dump triggered a callout then the
    Linux kernel was not stuck inside a device driver.

    We can also say it looks like the gethostbyname is in YP code doing a UDP
    call so at OS level you may want to check out the name resolution
    configuration. You probably dont want to be falling all the way back to
    UDP requests to get hostnames resolved.

    So if the problem recurs it would help to get:
    ps information of the process (to see if it uses CPU at all)

    strace for a few minutes – this should help show if the
    process is entering / leaving any system call (eg: poll)

    A full call stack with arguments from either gdb or errorstack
    and these should help show the arguments passed up the stack.

    In gdb you can also do something like attach to the problem process
    and :
    break osncon
    break nigcall
    break niotns
    etc.. up the stack to gethostbyname and then “cont”
    and it should stop if it enters into those functions from below
    helping indicate a spin/loop point below that point.

    It may also be worth getting Linux “crash” information for the
    process to see what the process looks like from the Linux side
    but follow up with the OS team on that side.

    SQLNET.OUTBOUND_CONNECT_TIMEOUT is a backup mechanism to help prevent

    This note claimed that one session may hold library cache lock , and wait in single-task message
    after it makes an outbound DBlink call.If another session wants that lock in an incompatible mode then it has to wait.
    The “single-task message” wait event is started / ended in kpnconn() so if there was a “spin” it would have to be
    above that point in the stack. Oracle support advise to set SQLNET.OUTBOUND_CONNECT_TIMEOUT so that
    we can expect a session in this state to then timeout which may be useful if there are underlying issues with
    TCP hostname resolution. The principle in these cases is identical.
    Do deep digging ,you can see this Knowledge:

    Hdr: 8427478 10.2.0.3 RDBMS 10.2.0.3 PI/DISTRIB PRODID-5 PORTID-23 ORA-12170
    Abstract: WHEN USING DBLINK,IT CONNECT TWICE AND TAKE DOBULE-TIME FOR TIME-OUT( ORA-12170)
    PROBLEM:
    ——–
    When client connect to database using TCP/IP, if there are some problems
    in the network and server , The client recevies ORA-12170 (ETIMEDOUT)
    The timeout time is depend on OS TCP parameter.(e.g. tcp_syn_retries
    parameter on Linux platform).

    ERROR:
    ORA-12170 : TNS:Connect timeout occurred

    ** sqlnet.log ***************************************************
    VERSION INFORMATION:
    TNS for Linux: Version 10.2.0.3.0 – Production
    TCP/IP NT Protocol Adapter for Linux: Version 10.2.0.3.0 – Production
    Time: 10-APR-2009 21:38:41
    Tracing not turned on.
    Tns error struct:
    ns main err code: 12535
    TNS-12535: TNS:operation timed out
    ns secondary err code: 12560
    nt main err code: 505
    TNS-505: Operation timed out
    nt secondary err code: 110 <= ETIMEDOUT nt OS err code: 0 Client address:
    ** sqlnet.log ***************************************************

    client server
    | |
    connect() |
    |——-x–>|——–
    | SYN | |
    |——-x–>| |
    | SYN | |
    |——-x–>| |
    | SYN | |when setting tcp_syn_retries=5(default)
    |——-x–>| | It takes about 189 seconds for time-out.
    | SYN | |
    |——-x–>| |
    | SYN | |
    |——-x–>| |
    | SYN | |
    ———————
    ORA-12170 occur.

    But, the connection via DBLINK, it sometimes try to connect twice. and
    it takes double-time for time-out.

    local site remote site
    | |
    connect() |
    |——-x–>|——–
    | SYN | |
    |——-x–>| |
    | SYN | |
    |——-x–>| |
    | SYN | |
    |——-x–>| |
    | SYN | |
    |——-x–>| |
    | SYN | |
    |——-x–>| |
    | SYN | |
    ORA-12170 occur ,but it not returning to client.
    and server process of local site try to connect automatically.(2nd connect)
    connect() | |
    |——-x–>| |
    | SYN | |
    |——-x–>| | It takes about 378 seconds for time-out.
    | SYN | |
    |——-x–>| |
    | SYN | |
    |——-x–>| |
    | SYN | |
    |——-x–>| |
    | SYN | |
    |——-x–>| |
    | SYN | |
    ———————
    ORA-12170 occur.

    The problem is that it takes dobule-time by this behavior using DBLINK.

    DIAGNOSTIC ANALYSIS:
    ——————–
    We got stack trace when trying connect.

    1st connect
    connect()+36<- nttcon()+965<- ntconn()+265<- nsopen()+1335 <- nscall1()+449<- nscall()+609<- niotns()+1678<- nigcall()+112 <- osncon()+692<- kpkiadef()+58<- upiini()+683<- upiah0()+104 <- kpuatch()+1064<- OCIServerAttach()+129<- kpnconn()+463 <- npicon0()+1250<- kpndbcon()+909<- OCIKDBLinkConn2()+40 <- OCIKDBLinkConn()+36<- ddfnet3Share()+151<- kksarm()+480<- kksauc()+481 <- kksCheckCriteria()+1711<- kksCheckCursor()+226 <- kksSearchChildList()+1496 <- kksfbc()+10276<- kkspsc0()+1903<- kksParseCursor()+132<- opiosq0()+1349 <- kpooprx()+215<- kpoal8()+673<- opiodr()+985<- ttcpip()+1093<- opitsk()+1031 <- opiino()+821<- opiodr()+985<- opidrv()+466<- sou2o()+91<- opimai_real()+117 <- main()+111<- __libc_start_main()+161 2nd connect <- connect()+36<- nttcon()+965<- ntconn()+265<- nsopen()+1335<- nscall1()+449<- nscall()+609 <- niotns()+1678<- nigcall()+112<- osncon()+692<- kpkiadef()+58<- upiini()+683<- upiah0()+104 <- kpuatch()+1064<- OCIServerAttach()+129<- kpnconn()+463<- npicon0()+1250<- kpndbcon()+909 <- OCIKDBLinkConn2()+40<- OCIKDBLinkConn()+36<- ddfnet2Normal()+204<- kkmfcbrm()+132 <- __PGOSF172_kkmpfcbk()+473<- qcsprfro()+503<- qcsprfro_tree()+302<- qcsprfro_tree()+118 <- qcspafq()+102<- qcspqb()+347<- kkmdrv()+60<- opiSem()+1044<- opiDeferredSem()+283 <- opitca()+275<- __PGOSF302_kksFullTypeCheck()+20<- rpiswu2()+334<- kksLoadChild()+5852 <- kxsGetRuntimeLock()+1314<- kksfbc()+12270<- kkspsc0()+1903<- kksParseCursor()+132 <- opiosq0()+1349<- kpooprx()+215<- kpoal8()+673<- opiodr()+985<- ttcpip()+1093 <- opitsk()+1031<- opiino()+821<- opiodr()+985<- opidrv()+466<- sou2o()+91<- opimai_real()+117 <- main()+111<- __libc_start_main()+161<- WORKAROUND: ----------- execute following command before connect. SQL> alter system flush shared_pool;

    You can find the kpnconn call in stack trace , so the single-task message may occur in two time dblink reconnect and take a long time.
    The document provide one workaround way: flush shared_pool.which I suspected.
    In summary , still no Mature program to resolve this problem , All we can do is pray.
    In my opinion , Version 10.2.0.4 is stable enough within most layer , but still a lots of bug or unexpected behavior reside in K2(kernel Distributed Execution Layer). Distributed system is a really complicated subject in computer science.

    沪ICP备14014813号-2

    沪公网安备 31010802001379号