Oracle11g升级项目实施流程
11g deferred_segment_creation特性
TTS ORACLE Transporting Tablespaces传输表空间统计信息
1. 使用expdp+TRANSPORT_TABLESPACES时默认会导出相关表空间上对象的统计信息。 可以用exclude=TABLE_STATISTICS,INDEX_STATISTICS禁止导出统计信息。
2. 使用dbms_stats.lock_table_stats锁住的统计信息, 在TTS导入后仍保持锁定状态
SQL>
SQL> create tablespace fortts datafile size 20M;
表空间已创建。
SQL> conn maclean/oracle
已连接。
SQL> create table tvbs as select * from dba_objects;
表已创建。
SQL> exec dbms_stats.gather_table_stats(USER,’TVBS’);
PL/SQL 过程已成功完成。
SQL> alter table tvbs move tablespace fortts;
表已更改。
SQL> alter tablespace fortts read only;
表空间已更改。
C:\Users\xiangbli>expdp maclean/oracle TRANSPORT_TABLESPACES=FORTTS dumpfile=temp:tts.dmp
Export: Release 11.2.0.3.0 – Production on 星期五 2月 8 10:26:49 2013
Copyright (c) 1982, 2011, Oracle and/or its affiliates. All rights reserved.
连接到: Oracle Database 11g Enterprise Edition Release 11.2.0.3.0 – 64bit Production
With the Partitioning, OLAP, Data Mining and Real Application Testing options
启动 “MACLEAN”.”SYS_EXPORT_TRANSPORTABLE_01″: maclean/******** TRANSPORT_TABLESPACES=FORTTS dumpfile=temp:tts.dmp
处理对象类型 TRANSPORTABLE_EXPORT/PLUGTS_BLK
处理对象类型 TRANSPORTABLE_EXPORT/TABLE
处理对象类型 TRANSPORTABLE_EXPORT/TABLE_STATISTICS
处理对象类型 TRANSPORTABLE_EXPORT/POST_INSTANCE/PLUGTS_BLK
已成功加载/卸载了主表 “MACLEAN”.”SYS_EXPORT_TRANSPORTABLE_01″
******************************************************************************
MACLEAN.SYS_EXPORT_TRANSPORTABLE_01 的转储文件集为:
C:\TTS.DMP
******************************************************************************
可传输表空间 FORTTS 所需的数据文件:
C:\APP\XIANGBLI\ORADATA\TESTMAC\DATAFILE\O1_MF_FORTTS_8K8RGX6W_.DBF
作业 “MACLEAN”.”SYS_EXPORT_TRANSPORTABLE_01″ 已于 10:27:41 成功完成
C:\Users\xiangbli>expdp maclean/oracle TRANSPORT_TABLESPACES=FORTTS dumpfile=temp:tts1.dmp exclude=TABLE_STATISTICS,INDEX_STATISTICS
Export: Release 11.2.0.3.0 – Production on 星期五 2月 8 10:28:25 2013
Copyright (c) 1982, 2011, Oracle and/or its affiliates. All rights reserved.
连接到: Oracle Database 11g Enterprise Edition Release 11.2.0.3.0 – 64bit Production
With the Partitioning, OLAP, Data Mining and Real Application Testing options
启动 “MACLEAN”.”SYS_EXPORT_TRANSPORTABLE_02″: maclean/******** TRANSPORT_TABLESPACES=FORTTS dumpfile=temp:tts1.dmp exclude=TABLE_STATISTICS,INDEX_STATISTICS
处理对象类型 TRANSPORTABLE_EXPORT/PLUGTS_BLK
处理对象类型 TRANSPORTABLE_EXPORT/TABLE
处理对象类型 TRANSPORTABLE_EXPORT/POST_INSTANCE/PLUGTS_BLK
已成功加载/卸载了主表 “MACLEAN”.”SYS_EXPORT_TRANSPORTABLE_02″
******************************************************************************
MACLEAN.SYS_EXPORT_TRANSPORTABLE_02 的转储文件集为:
C:\TTS1.DMP
******************************************************************************
可传输表空间 FORTTS 所需的数据文件:
C:\APP\XIANGBLI\ORADATA\TESTMAC\DATAFILE\O1_MF_FORTTS_8K8RGX6W_.DBF
作业 “MACLEAN”.”SYS_EXPORT_TRANSPORTABLE_02″ 已于 10:28:57 成功完成
copy C:\APP\XIANGBLI\ORADATA\TESTMAC\DATAFILE\O1_MF_FORTTS_8K8RGX6W_.DBF C:\APP\XIANGBLI\ORADATA\TESTMAC\DATAFILE\O1_MF_FORTTS_8K8RGX6W_1.DBF
C:\Users\xiangbli>impdp maclean/oracle TRANSPORT_DATAFILES=C:\APP\XIANGBLI\ORADATA\TESTMAC\DATAFILE\O1_MF_FORTTS_8K8RGX6W_1.DBF dumpfile=temp:tts.dmp
Import: Release 11.2.0.3.0 – Production on 星期五 2月 8 10:36:14 2013
Copyright (c) 1982, 2011, Oracle and/or its affiliates. All rights reserved.
连接到: Oracle Database 11g Enterprise Edition Release 11.2.0.3.0 – 64bit Production
With the Partitioning, OLAP, Data Mining and Real Application Testing options
已成功加载/卸载了主表 “MACLEAN”.”SYS_IMPORT_TRANSPORTABLE_01″
启动 “MACLEAN”.”SYS_IMPORT_TRANSPORTABLE_01″: maclean/******** TRANSPORT_DATAFILES=C:\APP\XIANGBLI\ORADATA\TESTMAC\DATAFILE\O1_MF_FORTTS_8K8RGX6W_1.DBF dumpfil
e=temp:tts.dmp
处理对象类型 TRANSPORTABLE_EXPORT/PLUGTS_BLK
处理对象类型 TRANSPORTABLE_EXPORT/TABLE
处理对象类型 TRANSPORTABLE_EXPORT/TABLE_STATISTICS
处理对象类型 TRANSPORTABLE_EXPORT/POST_INSTANCE/PLUGTS_BLK
作业 “MACLEAN”.”SYS_IMPORT_TRANSPORTABLE_01″ 已于 10:36:18 成功完成
SQL> select NUM_ROWS,blocks ,LAST_ANALYZED from dba_tables where table_name=’TVBS’ and owner=’MACLEAN’;
NUM_ROWS BLOCKS LAST_ANALYZED
———- ———- ————–
75356 1099 08-2月 -13
2. 使用dbms_stats.lock_table_stats锁住的统计信息, 在TTS导入后仍保持锁定状态
SQL> exec dbms_stats.lock_table_stats(‘MACLEAN’,’TVBS’);
PL/SQL 过程已成功完成。
C:\Users\xiangbli>expdp maclean/oracle TRANSPORT_TABLESPACES=FORTTS dumpfile=temp:tts2.dmp
Export: Release 11.2.0.3.0 – Production on 星期五 2月 8 10:39:44 2013
Copyright (c) 1982, 2011, Oracle and/or its affiliates. All rights reserved.
连接到: Oracle Database 11g Enterprise Edition Release 11.2.0.3.0 – 64bit Production
With the Partitioning, OLAP, Data Mining and Real Application Testing options
启动 “MACLEAN”.”SYS_EXPORT_TRANSPORTABLE_01″: maclean/******** TRANSPORT_TABLESPACES=FORTTS dumpfile=temp:tts2.dmp
处理对象类型 TRANSPORTABLE_EXPORT/PLUGTS_BLK
处理对象类型 TRANSPORTABLE_EXPORT/TABLE
处理对象类型 TRANSPORTABLE_EXPORT/TABLE_STATISTICS
处理对象类型 TRANSPORTABLE_EXPORT/POST_INSTANCE/PLUGTS_BLK
已成功加载/卸载了主表 “MACLEAN”.”SYS_EXPORT_TRANSPORTABLE_01″
******************************************************************************
MACLEAN.SYS_EXPORT_TRANSPORTABLE_01 的转储文件集为:
C:\TTS2.DMP
******************************************************************************
可传输表空间 FORTTS 所需的数据文件:
C:\APP\XIANGBLI\ORADATA\TESTMAC\DATAFILE\O1_MF_FORTTS_8K8RGX6W_1.DBF
作业 “MACLEAN”.”SYS_EXPORT_TRANSPORTABLE_01″ 已于 10:40:15 成功完成
SQL> drop tablespace fortts including contents;
表空间已删除。
impdp maclean/oracle TRANSPORT_DATAFILES=C:\APP\XIANGBLI\ORADATA\TESTMAC\DATAFILE\O1_MF_FORTTS_8K8RGX6W_2.DBF dumpfile=temp:tts2.dmp
Import: Release 11.2.0.3.0 – Production on 星期五 2月 8 10:42:02 2013
Copyright (c) 1982, 2011, Oracle and/or its affiliates. All rights reserved.
连接到: Oracle Database 11g Enterprise Edition Release 11.2.0.3.0 – 64bit Production
With the Partitioning, OLAP, Data Mining and Real Application Testing options
已成功加载/卸载了主表 “MACLEAN”.”SYS_IMPORT_TRANSPORTABLE_01″
启动 “MACLEAN”.”SYS_IMPORT_TRANSPORTABLE_01″: maclean/******** TRANSPORT_DATAFILES=C:\APP\XIANGBLI\ORADATA\TESTMAC\DATAFILE\O1_MF_FORTTS_8K8RGX6W_2.DBF dumpfil
e=temp:tts2.dmp
处理对象类型 TRANSPORTABLE_EXPORT/PLUGTS_BLK
处理对象类型 TRANSPORTABLE_EXPORT/TABLE
处理对象类型 TRANSPORTABLE_EXPORT/TABLE_STATISTICS
处理对象类型 TRANSPORTABLE_EXPORT/POST_INSTANCE/PLUGTS_BLK
作业 “MACLEAN”.”SYS_IMPORT_TRANSPORTABLE_01″ 已于 10:42:04 成功完成
SQL> exec dbms_stats.gather_table_stats(‘MACLEAN’,’TVBS’);
BEGIN dbms_stats.gather_table_stats(‘MACLEAN’,’TVBS’); END;
*
第 1 行出现错误:
ORA-20005: object statistics are locked (stattype = ALL)
ORA-06512: 在 “SYS.DBMS_STATS”, line 23829
ORA-06512: 在 “SYS.DBMS_STATS”, line 23880
ORA-06512: 在 line 1
11g使用10g的统计信息,由于优化器和统计信息算法的更新可能导致部分SQL执行计划不佳,发生的概率有但是较小。
可以考虑升级到11g后 重新收集大部分不是非常大的表的统计信息和执行dbms_stats.gather_fixed_objects_stats, 耗时最多的大表在后续可用时段收集。
对于SQL执行计划,可以考虑使用SQL PROFILE、SQL PLAN Management、Hint等技术固定。
11g以后的space preallocation特性和SMCO/W00N
11g以后oracle引入了智能空间预分配space preallocation的新特性,该新特性涉及3个领域:
- 表空间的预分配和扩展
- 数据段segment的预分配和扩展
- LOB chunk的预分配和扩展
以下是一个tablespace 预分配和扩展的例子,可以看到某个表空间对应的FILE#=3的数据文件,由于在一段时间内的空间使用情况预估,所以在几个小时内扩展了不少的空间:
Sat Oct 04 06:07:46 2014
Resize operation completed for file# 3, old size 706560K, new size 716800K
Sat Oct 04 08:00:03 2014
www.askmac.cn
Thread 1 advanced to log sequence 60 (LGWR switch)
  Current log# 2 seq# 60 mem# 0: /s01/oradata/PDPROD/onlinelog/o1_mf_2_b2wgc3rf_.log
  Current log# 2 seq# 60 mem# 1: /s01/fast_recovery_area/PDPROD/onlinelog/o1_mf_2_b2wgc4mf_.log
Sat Oct 04 08:00:05 2014
TT00: Standby redo logfile selected for thread 1 sequence 60 for destination LOG_ARCHIVE_DEST_2
Sat Oct 04 08:00:06 2014
Archived Log entry 79 added for thread 1 sequence 59 ID 0xe5f08f5 dest 1:
Sat Oct 04 08:08:00 2014
www.askmac.cn
Resize operation completed for file# 3, old size 716800K, new size 727040K
Sat Oct 04 10:08:37 2014
Thread 1 advanced to log sequence 61 (LGWR switch)
  Current log# 3 seq# 61 mem# 0: /s01/oradata/PDPROD/onlinelog/o1_mf_3_b2wgc6ol_.log
  Current log# 3 seq# 61 mem# 1: /s01/fast_recovery_area/PDPROD/onlinelog/o1_mf_3_b2wgc70g_.log
Sat Oct 04 10:08:37 2014
TT00: Standby redo logfile selected for thread 1 sequence 61 for destination LOG_ARCHIVE_DEST_2
Sat Oct 04 10:08:40 2014
Archived Log entry 81 added for thread 1 sequence 60 ID 0xe5f08f5 dest 1:
Sat Oct 04 13:08:34 2014
Resize operation completed for file# 3, old size 727040K, new size 737280K
Sat Oct 04 14:04:39 2014


Resize operation completed for file# 3, old size 747520K, new size 757760K
以上这种扩展受到Oracle内部预定义的参数TBS_EXTENSION_MAX_STEP_SIZE(64MB)的限制,即最大一次扩展是64MB,可以从上述日志看到大多数扩展在这里是一次10MB。
对于表空间预分配, space preallocation特性会基于过去6个小时内的表空间使用情况,每隔10分钟分析一次,基于以下的数据分析:
- Database id – Database identifier
- Tablespace id – Tablespace identifier number
- Creation SCN (wrap, base) [NEW] – SCN when the tablespace is created. This is for tablespace sanity check in case that the tablespace is dropped or recreated after the statistics is collected.
- Allocated space – Space allocated to the tablespace
- Used space – Space currently used in the tablespace. For permanent tablespace, it is represented by the used extents. For temporary tablespace, this should be the space used by active sorts, hash joins and other transient objects.
- Max size – Maximum size of the tablespace
- Flag – Tablespace flag (e.g. perm/temp/undo)
- Stat-collection Timestamp [NEW] – The time when the statistics is collected
对于数据段segment预分配,数据段的统计信息会每半个小时flush到AWR中(WRH$_SEG_STAT),Segment growth trend数据段的增长趋势也会每半个小时完成一次, 基于以下的数据分析:
- Tablespace id
- Tablespace creation SCN (wrap, base) [NEW]
- Segment obj#
- Segment dataobj#
- Number of allocated blocks
- Number of used blocks
- Stat-collect Timestamp [NEW] – The time when the statistics is collected
- Last-analysis timestamp [NEW] – The time when the segment is analyzed the last time
- Number of forecasted used blocks [NEW]
LOB chunk的使用情况 会每10分钟记录在内存中,也会定期flush到AWR中,基于以下的数据分析:
- Instance id
- Tablespace id
- Tablespace creation SCN (wrap, base)
- Segment obj#
- Segment dataobj#
- Number of estimated optimal allocation for each chunk size (Ne) – One occurrence of an allocation for a chunk size refers to a planned
- allocation of the optimal chunk size that is calculated by the space layer when receiving a chunk allocation request from the data layer.
- Number of allocations for each chunk size (Na)
- Number of deallocation for each chunk size (Nd)
- Number of under-allocation for each chunk size (Nu)
- Number of split for each chunk size (Ns)
- Number of projected allocations for each chunk size (Np)
- Timestamp – The time when the statistics is collected
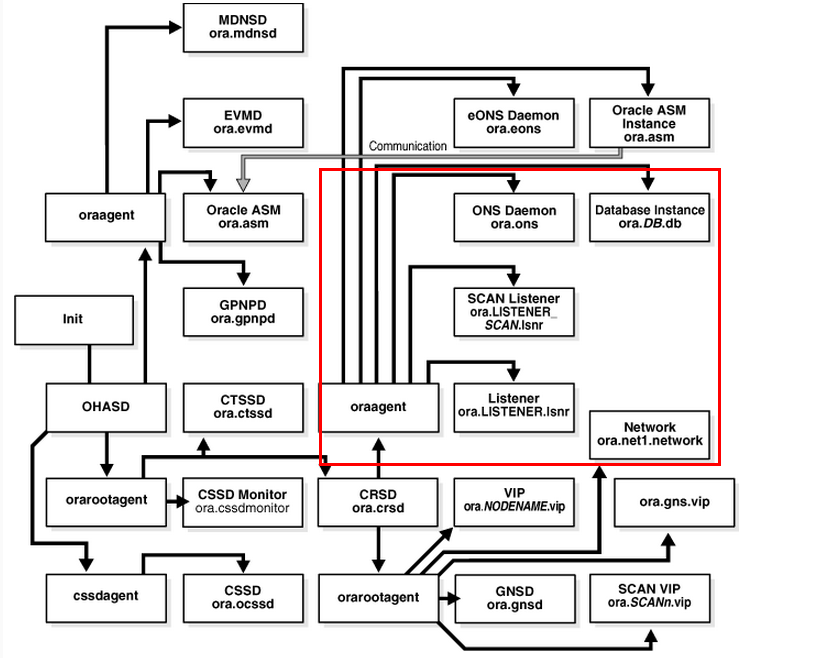
这些预分配和扩展任务主要由SMCO(Space Management Coordinator Process)和其小工进程W00n(slave )一起完成。 SMCO和W00n是基于任务task驱动的后台任务Framework。这个后台任务体系是基于实例的,而非基于数据库的。每一个实例instance有其自己的后台任务服务体系,运行和处理在本实例发起的任务。RAC的不同实例之间不会交互来负责此种任务的负载。
Task coordinator ( SMCO ) ,SMCO充当调度进程以便管理任务队列和slave进程池。其主要任务是在几个task queue之间移动任务,清理过期任务,基于任务需要来动态分配新的slave(W00n)进程,并监控slave进程。 一个实例只有一个SMCO进程,且SMCO进程不是fatal进程,kill了一般也没事。
部分12c新特性 Policy Driven Data Movement and ILM(Information Lifecycle Management) Project 数据生命周期管理也依赖于SMCO后台进程。
SMON,SMON是老牌后台进程 已经负责了一系列任务。其现在也负载动态启动SMCO进程。SMON现在会定期检查SMCO是否启动着,SMON也会当有任务提交时启动SMCO。
W00n等一组Slave Process,Slave进程总是实际干活的人。Salve process由SMCO这个调度器动态分配。一旦启动后,slave 进程将自主工作,其自动从ready-task队列中找寻任务并执行。如果空闲了过长时间,那么W00n也会自行终止。
其大致的工作流程如下:
- The foreground system/user session submits a task through ktsjCreateTask.
- The task is created. If the task is planned to start right away, it is inserted into one of the ready-task queue directly, otherwise, it isinserted into the not-ready-task queue.
- If SMCO does not exist, post SMON to start SMCO .
- If SMCO is available, post SMCO that a new task is available.
- SMCO knows that there is a task that needs to be run in the near future. It starts a slave process.
- SMCO moves the task from the not-ready queue to the ready queue and posts any waiting slave.
- The slave process picks up the task from the ready queue and invokes the task’s callback function.
- The task is done. The slave process executes the completion call back of the task.
- The slave process post SMCO that a task is finished. askmac.cn
- SMCO updates task execution statistics and may choose to free the task if there is no enough memory for task cache.
- The slave process periodically checks if there is any task in the ready-task queue.
与该11g以后的space preallocation特性相关的参数如下:
_enable_space_background_task/_enable_spacebg – This parameter specifies whether the background task support is enabled.
_max_ smco _slaves – This parameter specifies the maximum number of active slave process that can be spawned at a time. Ideally, the number
of slave processes should be decided by the system workload and the availability of system resources.
_max_ smco _tasks – This parameter specifies the maximum number of tasks that can be stored in memory. Ideally, the number of tasks should be
decided by the availability of SGA memory and the efficiency of task maintenance. Too many cached tasks will simply increase the burden of
task maintenance.
_enable_space_background_task
Parameter Name: _enable_space_background_task
Parameter Type: boolean
Allowable Values: TRUE to enable the feature, and FALSE to disable the feature
Default Value: TRUE. The space management background task support will be enabled by default.
Description: This parameter allows the user to choose whether to enable the space management background task support feature.
Dynamic: The parameter is dynamic and the scope is ALTER SYSTEM.
Example: alter system set “_enable_space_background_task ” = TRUE
_enable_space_preallocation
Parameter Name: _enable_space_preallocation
Parameter Type: integer
Allowable Values:
0x00: disable all levels of space preallocation
0x01: enable tablespace extension ahead of time
0x02: enable segment growth ahead of time
0x04: enable chunk allocation ahead of time
Combination of any of the above 3 levels of space preallocation Default Value: 0x07. The space preallocation at all levels will be enabled by default. However, whether the space preallocation will be done and how much space will be allocated relies on the system monitor analysis result.
Description: This parameter allows the user to enable different levels of space preallocation.
Dynamic: The parameter is dynamic and the scope is ALTER SYSTEM.
Example: alter system set “_enable_space_prealloaction ” = 1
_max_spacebg_slaves
the parameter that allows user to set maximum number of space BG slaves
_minmax_spacebg_slaves
the parameter that allows user to set min-max number of space BG slaves
_min_spacebg_slaves
the parameter that allows user to set minimum number of space BG slaves
_max_spacebg_tasks
the parameter that specifies the maximum number of space BG tasks
_max_spacebg_msgs_percentage
the parameter that specifies percentage of _messages (ksaxxm) before KTSJ
throttling occurs. Default level is 50%. When throttle level is reached,
interrupt messages are not sent (thus avoiding _messages queue).
_enable_space_preallocation 3 enable space pre-allocation
_enable_spacebg TRUE enable space management background task
_max_spacebg_slaves 1024 maximum space management background slaves
_minmax_spacebg_slaves 8 min-max space management background slaves
_min_spacebg_slaves 2 minimum space management background slaves
_max_spacebg_tasks 8192 maximum space management background tasks
_max_spacebg_msgs_percentage 50 maximum space management interrupt message throttling
对于由于SMCO 或W00n在完成space preallocation过程中遇到的问题时,可以考虑禁用该特性,具体方法为:
SQL> alter system set "_enable_spacebg"=false;

System altered.

SQL> alter system set "_enable_space_preallocation"=0;

System altered.
SMCO/Wnnn
Short Description: The space management coordinator (SMCO) process coordinates the execution of
various space management related tasks, such as proactive space allocation and space reclamation. It
dynamically spawns slave processes (Wnnn) to implement the task.
Detailed Description: The space management coordinator (SMCO) and slave (Wnnn) processes work
cooperatively on various background space management tasks in a database instance. The coordinator
is responsible for maintaining the tasks and dispatching tasks. It dynamically spawns new slaves based
on task needs. The slave process performs the actual space management task, including space preallocation
and space reclamation. Once started, the slave process acts as an autonomous agent. After
it finishes execution of the task, it automatically pick up another one from the task queue. It terminates
itself after being idle for a long time. SMCO and Wnnn are optional non-fatal background processes.
There is at most one SMCO process per instance. There can be several Wnnn processes at a time. The
failure of these processes does not cause instance to fail.
Properties: Optional, non-fatal, database instance only
ORACLE RAT Real Application Testing Checklist
Pre Capture Checklist
| Review database version & review list of one off patches applied as per MOS Note 560977.1 both for capture database as well as replay database | |
| Review AWR/Statspack reports from peak workload | |
| Review alert.log at least from last startup in the capture database | |
| Review hardware, storage details & disk space for capture database as well as replay database | |
| Estimate disk space required to do database capture | |
| Review current CPU & memory usage without database capture | |
| Review plan for SPA capture into the Sql Tuning Sets | |
| Review description of application & database feature usage | |
| Review the exact commands/scripts/navigation From EM to be used to do the database Capture as well as SPA capture | |
| Review plan for backup & restore of database | |
| Plan for a small duration dry run of database capture & database replay before moving to Large duration database capture & database replay |
Post Capture check List
| Review database capture report | |
| Review database capture period AWR report | |
| Export AWR data at the end of the database capture |
SPA
| Execute & review results of SPA trials & fix any identified SQL regressions in the test system where database replay will be done |
Preprocess side
| Review version of database & list of one off patches applied as per MOS Note 560977.1 | |
| Did the preprocess completed successfully | |
| Review workload analyzer report & follow recommendations |
Replay Side
| Review database version & List of one off patches applied as per MOS Note 560977.1.
Ensure database replay client WRC is executed from a patched ORACLE_HOME as per MOS Note 560977.1 |
|
| Review Hardware setup. Pay special attention for RAC & Exadata setup | |
| Review network related settings. Listener.ora, tnsnames.ora etc
Ensure to Isolate test database from production databases |
|
| Review database restore point and flashback setup | |
| Review schema setup. Validate No missing user, views, synonyms etc as compared to Capture database | |
| Review the exact commands/scripts/ navigation From EM & options to be used to do the Database Replay & deploy WRC. Review connection remapping | |
| Execute database replay of smaller duration capture & validate its success | |
| Execute database replay of larger duration capture & check if it completes successfully | |
| In case of problem follow MOS Note 1287620.1 for traces & other debug information. Open an SR if needed. Please Provide very detailed information. |
Post Replay
| Review Database Replay Report | |
| Review Compare period Report | |
| Review Replay Period AWR Report |
AIX平台上11.2 Grid Infrastructure RDBMS进程的user是grid用户?
注意这个问题目前发现仅发生在11.2 + AIX平台上,不管是Standalone Grid 还是RAC Grid Infrastructure 都可能遇到, 使用ps -ef列出RDBMS实例进程时发现进程的user是Grid ,照理来说$RDBMS_HOME/bin/oracle的拥有者是oracle,这些进程应当属于oracle用户; 这种现象可能仅发生在LOCAL=NO的服务进程上,也可能发生在包括后台进程上。
现象如下:
oracle@mac01:/home/oracle>ps -p
oracle@mac01:/home/oracle>ps -ef |grep -i local=no
    grid  3866680        1   0 17:11:03      -  0:08 oracleG11R231 (LOCAL=NO)
    grid  5374010        1   0 17:11:04      -  0:10 oracleG11R231 (LOCAL=NO)
    grid  5832916        1   0 17:11:04      -  0:07 oracleG11R231 (LOCAL=NO)
    grid  5898482        1   0 17:11:04      -  0:08 oracleG11R231 (LOCAL=NO)
    grid  5963946        1   0 19:08:47      -  0:00 oracleG11R231 (LOCAL=NO)
    grid  6160614        1   0 19:08:47      -  0:00 oracleG11R231 (LOCAL=NO)
    grid  6684846        1   0 17:11:03      -  0:08 oracleG11R231 (LOCAL=NO)
    grid  6947026        1   0 17:11:04      -  0:08 oracleG11R231 (LOCAL=NO)
    grid  8978436        1   0 19:08:47      -  0:00 oracleG11R231 (LOCAL=NO)
    grid  9961692        1   0 19:08:47      -  0:00 oracleG11R231 (LOCAL=NO)
    grid 10158178        1   0 19:08:47      -  0:21 oracleG11R231 (LOCAL=NO)
    grid 10354770        1   0 19:08:47      -  0:00 oracleG11R231 (LOCAL=NO)
    grid 10747936        1   0 17:43:13      -  0:08 oracleG11R231 (LOCAL=NO)
    grid 10944566        1   0 19:08:47      -  0:00 oracleG11R231 (LOCAL=NO)
    grid 11403516        1   0 19:08:47      -  0:00 oracleG11R231 (LOCAL=NO)
    grid 11665480        1  91 19:08:46      -  4:45 oracleG11R231 (LOCAL=NO)
    grid 12255372        1   0 17:43:13      -  0:08 oracleG11R231 (LOCAL=NO)
    grid 12386550        1   0 19:08:46      -  0:00 oracleG11R231 (LOCAL=NO)
    grid 15466566        1   0 19:08:47      -  0:00 oracleG11R231 (LOCAL=NO)
  oracle 19005520 13697088   0 15:22:02  pts/2  0:00 grep -i local=no

oracle@mac01:/home/oracle>ps -p 15466566 -f
     UID      PID     PPID   C    STIME    TTY  TIME CMD
    grid 15466566        1   0 19:08:47      -  0:00 oracleG11R231 (LOCAL=NO)


oracle@mac01:/home/oracle>ps -p 15466566 -o uid,user,ruid,ruser,args
 UID     USER RUID    RUSER COMMAND
3001   oracle 3016     grid oracleG11R231 (LOCAL=NO)

oracle@mac01:/home/oracle>ls -l $ORACLE_HOME/bin/oracle
-rwsr-s--x    1 oracle   asmadmin  301231110 Sep 11 15:08 /s01/oracle/product/11.2.0/dbhome_1/bin/oracle
实际原因是 DB Instance在RAC环境中自动启动时是使用GRID用户名下的oraagent负责管理 ,oraagent 的login user 是grid,即real user id是GRID ,它负责调用call $RDBMS_HOME/bin/oracle 这个2进制文件(属于oracle用户 -rwsr-s–x 1 oracle asmadmin), 且该2进制文件是setuid的,当调用setuid 应用时effective user ID变成oracle, 但是 real user id是不变的。
关于 real user ID和effective user ID的解释如下:
Most of the time, the effective user ID of a process is just the same as the real ones, and there’s no point in making a fuss of this minor distinction.
Things start to get interesting when you invoke a setuid application, however. Assume you’re logging into your normal user account, which has a user ID of 500. Now you invoke a setuid root application. Because it’s setuid root, the operating system will set the the effective user ID of the process to that of the root user (0). The real user ID, however, remains unchanged. This allows the application to learn the identity of the user who invoked it, and to continue to access files etc with the privilege of the invoking user.
在Linux平台上不存在该问题, user和ruser均是oracle。
在AIX ps -p -f 显示的是login name of the process owner is shown,即real user id
ps -p -o user,ruser 显示的:
user Indicates the effective user ID of the process
ruser Indicates the real user ID of the process
BUG 9666617 – INSTANCE IS STARTED WITH USER GRID中分析了上述问题,并认为这不是一个软件bug close this as ‘not as bug’.
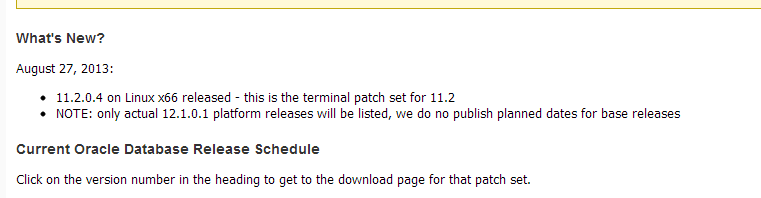
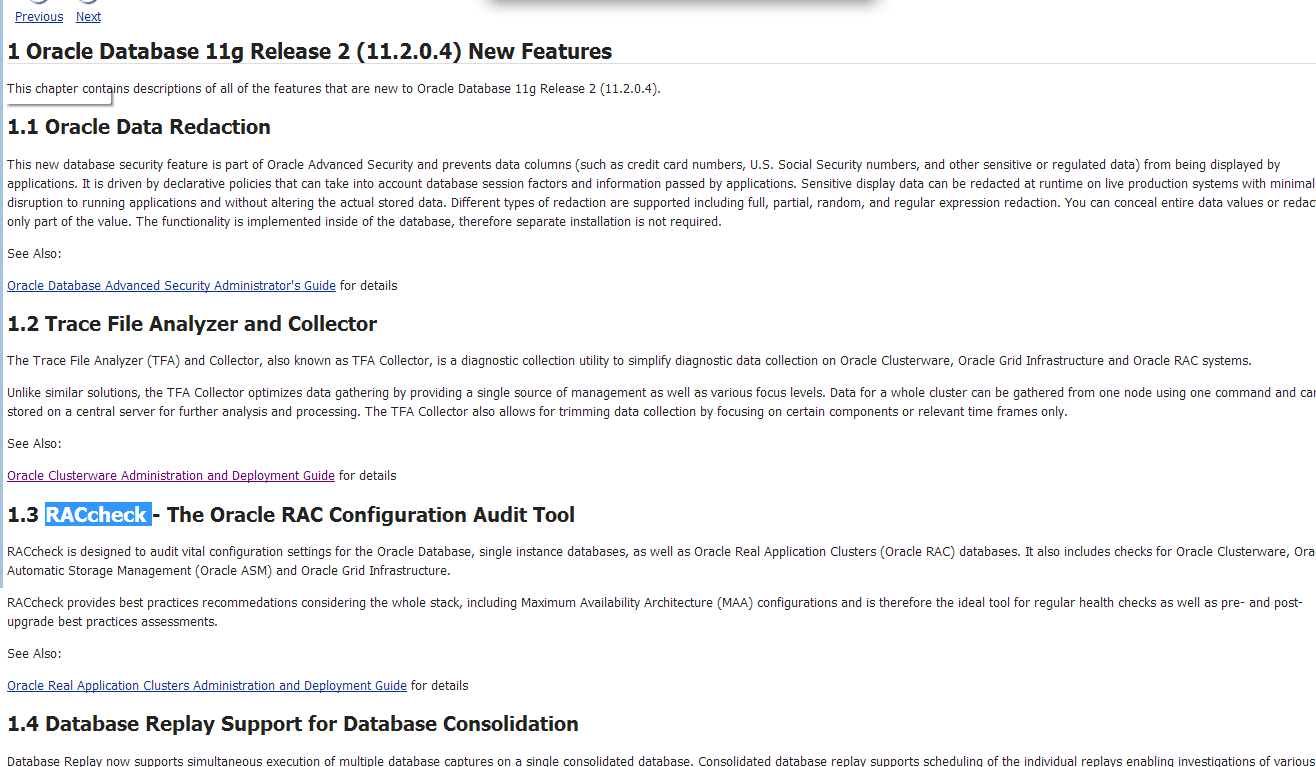
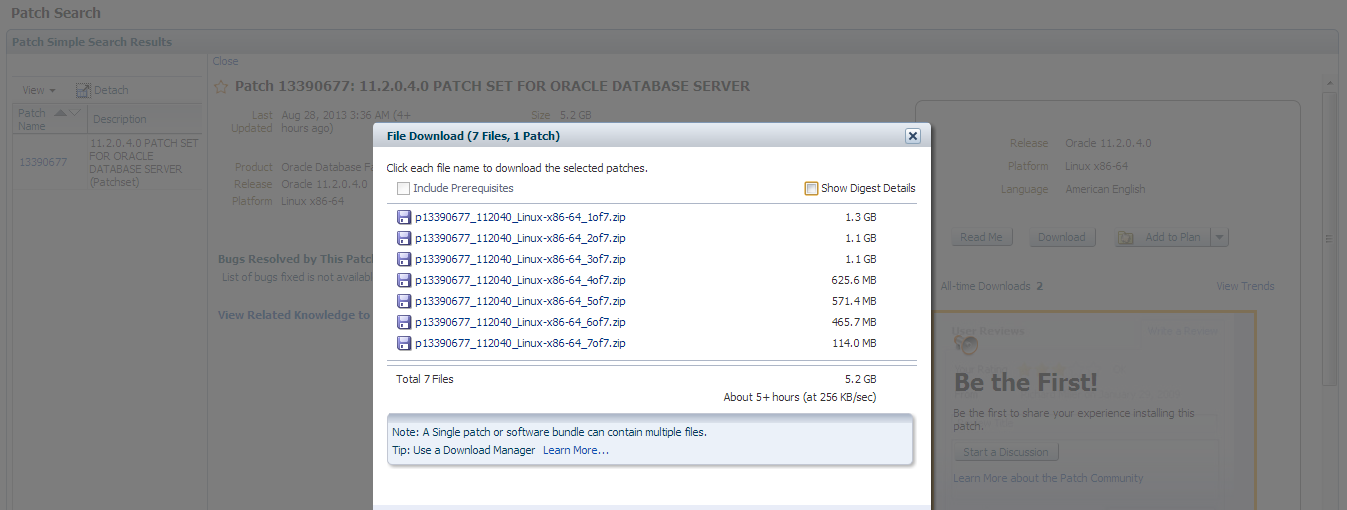
补丁集Patch Set 11.2.0.4 来了!
#ORACLE DATABASE PATCHSET# Oracle 11gR2重要更新 Patchset 11.2.0.4 已经release ,补丁号 patch 13390677. 相关文档Note 742060.1 . 11.2.0.4的新特性请参考这里 http://t.cn/z82pt6W 新特性包括 Trace File Analyzer (TFA) 和 RACcheck ; 11.2.0.4 来了!
【11g新特性】sec_max_failed_login_attempts
【11g新特性】sec_max_failed_login_attempts (默认为10,范围为1到unlimited)这个参数以11g 新特性形式引入, 文档对它的描述是
SEC_MAX_FAILED_LOGIN_ATTEMPTS specifies the number of authentication attempts that can be made by a client on a connection to the server process. After the specified number of failure attempts, the connection will be automatically dropped by the server process.
但是有同学怎么测试都无法生效, 实际该参数只对使用了OCI 的特定程序生效,而使用SQLPLUS是无法生效的, 坑爹的新特性:
SEC_MAX_FAILED_LOGIN_ATTEMPTS only works application uses OCI Program.SEC_MAX_FAILED_LOGIN_ATTEMPTS not work in sqlplus.
OCI Program have the following ,it wil work.
1.You need to use OCI_THREADED mode.
2.You need to set the attribute ofserver, username, password attributes in the appropriate handles:
3.You need to useOCISessionBegin to connect to the database
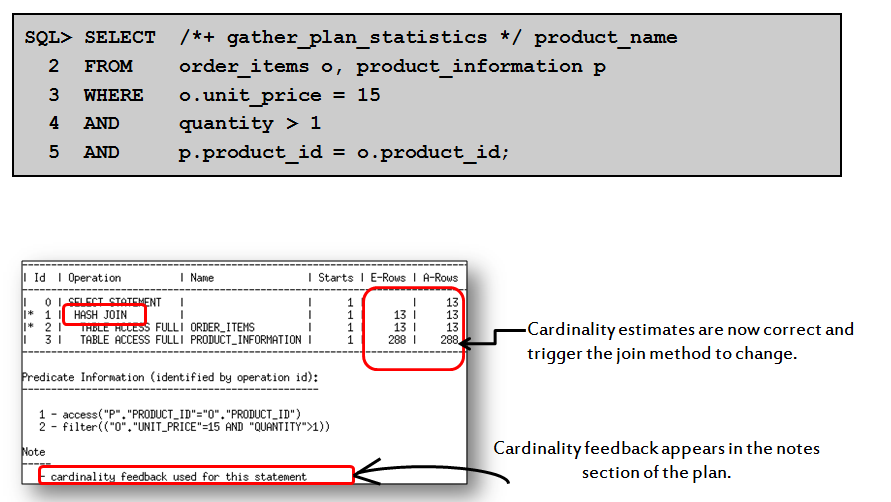
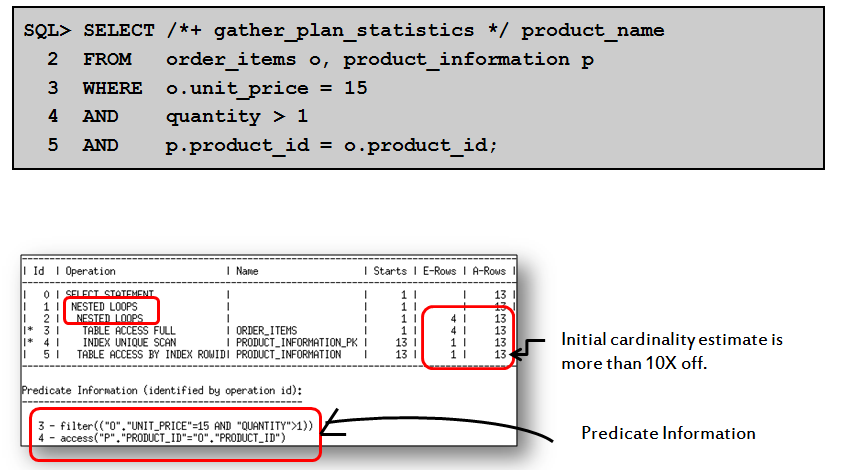
【11g新特性】Cardinality Feedback基数反馈
Cardinality Feedback基数反馈是版本11.2中引入的关于SQL 性能优化的新特性,该特性主要针对 统计信息陈旧、无直方图或虽然有直方图但仍基数计算不准确的情况, Cardinality基数的计算直接影响到后续的JOIN COST等重要的成本计算评估,造成CBO选择不当的执行计划。以上是Cardinality Feedback特性引入的初衷。
但是每一个Oracle新版本引入的新特性 都被一些老外DBA称之为buggy ,Cardinality Feedback基数反馈多少也造成了一些麻烦,典型的情况是测试语句性能时,第一次的性能最好,之后再运行其性能变差。
我们来看一下 Cardinality Feedback基数反馈是如何作用的:
注意使用普通用户来测试Cardinality Feedback,sys用户被默认禁用该特性
Oracle Database 11g Enterprise Edition Release 11.2.0.3.0 - 64bit Production
With the Partitioning, OLAP, Data Mining and Real Application Testing options

SQL> conn maclean/oracle
已连接。

SQL> show parameter dynamic

NAME                                 TYPE                   VALUE
------------------------------------ ---------------------- ------------------------------
optimizer_dynamic_sampling           integer                0

SQL> create table test as select * from dba_tables;

表已创建。

SQL> select /*+ gather_plan_statistics */ count(*) from test;

  COUNT(*)
----------
      2873

SQL> select * from table(dbms_xplan.display_cursor(null,null,'ALLSTATS LAST'));

PLAN_TABLE_OUTPUT
------------------------------------------------------------------------------------------------------
SQL_ID  0p4u1wqwg6t9z, child number 0
-------------------------------------
select /*+ gather_plan_statistics */ count(*) from test

Plan hash value: 1950795681

-------------------------------------------------------------------------------------
| Id  | Operation          | Name | Starts | E-Rows | A-Rows |   A-Time   | Buffers |
-------------------------------------------------------------------------------------
|   0 | SELECT STATEMENT   |      |      1 |        |      1 |00:00:00.01 |     104 |
|   1 |  SORT AGGREGATE    |      |      1 |      1 |      1 |00:00:00.01 |     104 |
|   2 |   TABLE ACCESS FULL| TEST |      1 |   8904 |   2873 |00:00:00.01 |     104 |
-------------------------------------------------------------------------------------

已选择14行。

SQL> select /*+ gather_plan_statistics */ count(*) from test;

  COUNT(*)
----------
      2873

SQL> select * from table(dbms_xplan.display_cursor(null,null,'ALLSTATS LAST'));

PLAN_TABLE_OUTPUT
---------------------------------------------------------------------------------------
SQL_ID  0p4u1wqwg6t9z, child number 1
-------------------------------------
select /*+ gather_plan_statistics */ count(*) from test

Plan hash value: 1950795681

-------------------------------------------------------------------------------------
| Id  | Operation          | Name | Starts | E-Rows | A-Rows |   A-Time   | Buffers |
-------------------------------------------------------------------------------------
|   0 | SELECT STATEMENT   |      |      1 |        |      1 |00:00:00.01 |     104 |
|   1 |  SORT AGGREGATE    |      |      1 |      1 |      1 |00:00:00.01 |     104 |
|   2 |   TABLE ACCESS FULL| TEST |      1 |   2873 |   2873 |00:00:00.01 |     104 |
-------------------------------------------------------------------------------------

Note
-----
   - cardinality feedback used for this statement

已选择18行。
上例中第一次运行时,由于未收集表上的统计信息且optimizer_dynamic_sampling=0 关闭了动态采样所以基数评估值(1)和实际值(2873)有着较大的差距。
cardinality feedback used for this statement这个信息说明第二次执行时使用了Cardinality Feedback基数反馈,且其基数评估也十分精确了,这是因为第二次执行时考虑到第一次执行时的基数反馈,我们来看看Oracle到底是如何做到的:
SQL> alter system flush shared_pool;

系统已更改。

SQL>
SQL> alter session set events '10053 trace name context forever, level 1';

会话已更改。

SQL>  select /*+ gather_plan_statistics */ count(*) from test;

  COUNT(*)
----------
      2873

SQL>  select /*+ gather_plan_statistics */ count(*) from test;

  COUNT(*)
----------
      2873

10053 trace:

第一次执行:

sql= select /*+ gather_plan_statistics */ count(*) from test
----- Explain Plan Dump -----
----- Plan Table -----

============
Plan Table
============
--------------------------------------+-----------------------------------+
| Id  | Operation           | Name    | Rows  | Bytes | Cost  | Time      |
--------------------------------------+-----------------------------------+
| 0   | SELECT STATEMENT    |         |       |       |    31 |           |
| 1   |  SORT AGGREGATE     |         |     1 |       |       |           |
| 2   |   TABLE ACCESS FULL | TEST    |  8904 |       |    31 |  00:00:01 |
--------------------------------------+-----------------------------------+

SELECT /*+ OPT_ESTIMATE (TABLE "TEST" ROWS=2873.000000 ) */ COUNT(*) "COUNT(*)" FROM "MACLEAN"."TEST" "TEST"

SINGLE TABLE ACCESS PATH
  Single Table Cardinality Estimation for TEST[TEST]
  Table: TEST  Alias: TEST
    Card: Original: 8904.000000    >> Single Tab Card adjusted from:8904.000000 to:2873.000000
  Rounded: 2873  Computed: 2873.00  Non Adjusted: 8904.00
  Access Path: TableScan
    Cost:  31.10  Resp: 31.10  Degree: 0
      Cost_io: 31.00  Cost_cpu: 1991217
      Resp_io: 31.00  Resp_cpu: 1991217
  Best:: AccessPath: TableScan
         Cost: 31.10  Degree: 1  Resp: 31.10  Card: 2873.00  Bytes: 0

sql= select /*+ gather_plan_statistics */ count(*) from test
----- Explain Plan Dump -----
----- Plan Table -----

============
Plan Table
============
--------------------------------------+-----------------------------------+
| Id  | Operation           | Name    | Rows  | Bytes | Cost  | Time      |
--------------------------------------+-----------------------------------+
| 0   | SELECT STATEMENT    |         |       |       |    31 |           |
| 1   |  SORT AGGREGATE     |         |     1 |       |       |           |
| 2   |   TABLE ACCESS FULL | TEST    |  2873 |       |    31 |  00:00:01 |
--------------------------------------+-----------------------------------+
可以看到第二次执行时SQL最终转换加入了 OPT_ESTIMATE (TABLE “TEST” ROWS=2873.000000 )的HINT ,OPT_ESTIMATE HINT一般由 kestsaFinalRound()内核函数生成。该HINT用以纠正各种类型的优化器评估,例如某表上的基数或某个列的最大、最小值。反应出优化的不足或者BUG。
可以通过V$SQL_SHARED_CURSOR和来找出现有系统shared pool中仍存在的 使用了Cardinality Feedback基数反馈的子游标:
SQL> select sql_ID,USE_FEEDBACK_STATS  FROM V$SQL_SHARED_CURSOR where USE_FEEDBACK_STATS ='Y';

SQL_ID                     US
-------------------------- --
159sjt1f6khp2              Y
还可以使用cardinality HINT来强制使用Cardinality Feedback 。
select /*+ cardinality(test, 1) */ count(*) from test;
如何禁用Cardinality Feedback基数反馈
对于这些”惹火”特性,为了stable,往往考虑关闭该特性。
可以通过多种方法禁用该特性
1. 使用 _optimizer_use_feedback 隐藏参数
session 级别
SQL> alter session set “_optimizer_use_feedback”=false;
会话已更改。
system级别
SQL> alter system set “_optimizer_use_feedback”=false;
系统已更改。
2. 使用opt_param(‘_optimizer_use_feedback’ ‘false’) HINT
例如:
select /*+ opt_param(‘_optimizer_use_feedback’ ‘false’) cardinality(test,1) */ count(*) from test;
