如何诊断ORA-125XX连接问题

以下这个Action Script是我收集的在解决ORA-125XX(如ORA-12560)这类网络链接故障时的一些思路,主要包括 现有的网络配置(client & server side)、监听日志、SQLNET Client trace等信息– How to troubleshooting ORA-125** connection issues:


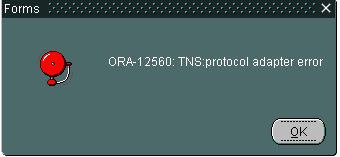
ORA-12560


# CHECK FIREWALL, WINDOWS FIREWALL , ANTI-Virus Software First !
ping hostname
tnsping TNS
trcroute TNS
telnet  <hostname> <port>  

tracert hostname

client side
sqlplus scott/tiger@TNS

&
server side
sqlplus scott/tiger@TNS

cat /etc/hosts
cat /etc/resolv.conf
cat /etc/nsswitch.conf
ipconfig -a
ping 127.0.0.1

$ORACLE_HOME/network/admin/sqlnet.ora
$ORACLE_HOME/network/admin/tnsnames.ora
$ORACLE_HOME/network/admin/listener.ora
$ORACLE_HOME/network/admin/endpoints_listener.ora
$ORACLE_HOME/network/log/*
sqlnet.log listener.log
/var/log/messages
/var/adm/messages
errpt -a

ls -ld $ORACLE_HOME
netstat -rn
ps -ef | grep -i tns
lsnrctl status {listener_name}
lsnrvtl services {listener_name}

ulimit -a

1. Complete database alert log.

2. If the database was not restarted from the time of last occurance of the
issue,

select * from v$resource_limit

3. RAM and SWAP configured on the server.

4. ulimit settings for oracle user:

ulimit -aS
ulimit -aH

5. Kernel parameter settings:

/etc/sysctl.conf

dblogin

show parameter cluster_database

show parameter listener

$srvctl config vip -n {nodename}

$lsnrctl status listener

agent.log and the crsd.log ..

crsd agent log and the crsd.log
$crsctl getperm resource ora.LISTENER.lsnr

sql net client trace , Client side tracing is done by adding the following syntax to the client’s sqlnet.ora file:

We will need a timestamped matching set of client/listener sqlnet traces while error is reproduced in order to find the root cause of the issue.

++ Enable client sqlnet tracing.
=======================

To do this add the following to client sqlnet.ora:

TRACE_LEVEL_CLIENT=16
TRACE_UNIQUE_CLIENT=TRUE
TRACE_DIRECTORY_CLIENT=path
TRACE_FILE_CLIENT=client
TRACE_TIMESTAMP_CLIENT=ON

replace path with a local directory for the trace files. (for example c:\temp)
Do a test connection from the problematic client and check if the trace files are created.
Upload the traces containing the error to me on metalink.

++ Enable listener sqlnet tracing.
==========================
To do this edit the listener.ora and add,

TRACE_LEVEL_{listener name}=16
TRACE_TIMESTAMP_{listener name}=TRUE
TRACE_DIRECTORY_{listener name}=/tmp {– this can be any directory other than a top level directory like / or c:\

Replace {listener name} with the name of the listener. For example if your listener was called LISTENER then TRACE_LEVEL_LISTENER=16

You need to restrict the amount of disk space used by the tracing then you must also set,

TRACE_FILELEN_{listener name}=500000 {– size of the files in K
TRACE_FILENO_{listener name}=10 {– number of files

This will limit the traces to 10 files of around 500Mb, so 5000Mb in total. When the 10th file is full it will reuse file number one.
You will need to stop/start the listener for this to take effect.
When the problem reproduces please can you upload the listener trace and the listener log.

Trace_level_client=16
Trace_directory_client={path_to_the_trace_directory} # use the full path to the trace directory
Trace_unique_client=on
Trace_timestamp_client=on
Diag_adr_enabled=off

trace Local listener or SCAN listeners
TRACE_LEVEL_{listener_name}= 16
TRACE_TIMESTAMP_{listener_name}=on
TRACE_DIRECTORY_{listener_name}={path_to_the_trace_directory}

truss -o /tmp/lisener.out -fae lsnrctl start {listener_name}

Some Useful Note:

Note.444705.1 TroubleShooting Guide For ORA-12514 TNS listener could not resolve SERVICE_NAME given in connect descriptor
Note.761740.1 Technicians Unable To Receive Orders While MWM Components Display ODBC Errors And Are Connected
Note.119007.1 ORA-12560: Administering the Listener on UNIX – Troubleshooting
Note 276812.1 TNS-12542 Error When Executing Batch Jobs or in High Transaction Environment
Note.219208.1 Ext/Pub Client Connection via Connect Manager Fails with TNS-12564
Note.393941.1 Ext/Mod ORA-12564 Reported When Using 10g Connection Manager
Note.1116960.1 ORA-609 TNS-12537 and TNS-12547 in 11g Alert.log
Note.550859.1 Abstract TROUBLESHOOTING GUIDE TNS-12518 TNS listener could not hand off client connection.
Note.207303.1 Client / Server / Interoperability Support Between Different Oracle Versions
Note.119706.1 Troubleshooting Guide TNS-12535 or ORA-12535 or ORA-12170 Errors

For database links between different Oracle versions connections must be supported in BOTH directions in the matrix found in Note 207303.1
eg: As 9.2 -} 7.3.4 is not supported then database links between these version
are not supported in either direction.
You are trying to connect two versions (client-server) that are not certified (as confirmed by Note 207303.1) and between which exist many technical incompatibilities.

CLIENT — LISTENER — SERVER RESULT

8 11.1 8 OK
9 11.1 9 OK
10 11.1 10 OK
11 11.1 11 OK

8 11.2 8 FAILS
9 11.2 9 OK
10 11.2 10 OK
11 11.2 11 OK

9 11.1 8 OK
10 11.1 8 OK
11 11.1 8 OK

9 11.2 8 FAILS
10 11.2 8 FAILS
11 11.2 8 FAILS

The relevant relationship that appears to be at issue is LISTENER and DATABASE. Client version is not a factor.

But if the ultimate outcome is that the 11.2 (11gR2) LISTENER is indicated (though I still haven’t seen documentation of this) as not compatible with use on a ORACLE 8i (8.1.7.0) DATABASE, then we’ll capture that here and move on. I would, however, like to see some evidence of this, if it is available. I can find notes in the KB about 10gR2’s listener not supporting 8i database, and I can find notes about 11gR1 having resolved that regression. But I can find nothing regarding listener/database compatibility that mentions 11gR2, that would explain our results.
Clients should be complied with Servers , For Sever 11.2 the only supported clients are 11.2.0 , 11.1.0 , 10.2.0 : 10g end MUST be at 10.2.0.2 (or higher) respectively in order to use PLSQL between those versions. See Note:4511371.8 for more details and finally 10.1.0.5 only with extended support .

On the other Side in order to connect from listener to DB server in a supported way , Listener version should be greater than or equal to the server version .

Note 207303.1 should still be followed.
Oracle数据库实用脚本

以下是Maclean.Liu所编写或收集的Oracle数据库实用脚本的列表,在这里分享一下:


Script:收集Enterprise Manager Grid Control/Agent/Database Control诊断信息
Script:收集Exadata诊断信息
Script:收集RAC诊断信息
Script:收集自动SGA内存管理ASMM诊断信息
Script:Collect vip resource Diagnostic Information
11g新特性:hangdiag.sql实例hang诊断脚本
Script:verify Oracle Object timestamp discrepancy
Script:SQL调优健康检查脚本
Script:列出本会话的细节信息
利用rowid分块实现非分区表的并行update与delete
Script:计算Oracle Streams进程所占用的内存大小
利用RMAN检测数据库坏块的脚本
Script:利用外部表实现SQL查询Oracle告警日志Alert.log
Script: 收集RAC DRM 诊断信息
Script:10g中不用EM显示Active Session Count by Wait Class
Script:数据库最近的性能度量
Script:收集数据库中用户的角色和表空间等信息
Script:收集介质恢复诊断信息
Script:收集Flashback Database Log诊断信息
Script:列出Oracle每小时的redo重做日志产生量
Script:收集11g Oracle实例IO性能信息
Script:检查数据库当前是否有备份操作在执行中
Script:List Schema/Table Constraints
Script:RAC Failover检验脚本loop.sh
Script:Diagnostic Resource Manager
Script:List Grid Control Jobs
Script:GridControl Repository Health Check
Script:诊断Scheduler信息
Script:优化crs_stat命令的输出
Script:Diagnostic Oracle Locks
Script:列出用户表空间的定额
Backup Script:Expdp Schema to ASM Storage
Script:Speed Up Large Index Create or Rebuild
Script:列出失效索引或索引分区
Script:列出数据库中5%以上链式行的表
Script:列出没有主键或唯一索引的表
Script:收集ASM诊断信息
Script:收集Oracle备份恢复信息
监控一个大事务的回滚
Script to Collect DB Upgrade/Migrate Diagnostic Information (dbupgdiag.sql)
Script:partition table into rowid extent chunks
Script:Oracle EBS数据库初始化参数健康检查脚本
Script:Monitoring Memory and Swap Usage to Avoid A Solaris Hang
SQL脚本:监控当前重做日志文件使用情况
Streams Health Check on 10g Release 2
从视图查询表分区的相关信息
Script To Monitor RDBMS Session UGA and PGA Current And Maximum Usage Over Time
Script:收集RAC性能诊断信息
Script:收集UNDO诊断信息
Script:列出数据库中子表上没有对应索引的外键
Script: Listing Memory Used By All Sessions
Collecting Diagnostic Data for OCFS2 Issues
Script to Identify Objects and Amount of Blocks in the Buffer Pools – Default, Keep, Recycle, nK Cache
Script:Generate A DDL Script For A Table
SCRIPT TO CHECK FOR FOREIGN KEY LOCKING ISSUES
如何找出Oracle中需要或值得重建的索引
Script:Diagnostic ORA-01000 maximum open cursors exceeded
ORA-4030 PGA Usage Diagnostic Script
Script:Tune Very Large Hash Join
Script to Collect Log File Sync Diagnostic Information (lfsdiag.sql)
Script:List Buffer Cache Details
Script:List NLS Parameters and Timezone
Script:List SORT ACTIVITY
Script:List OBJECT DEPENDENT
Script:Logfile Switch Frequency Map
Script:Tablespace Report
Script:收集数据库安全风险评估信息
脚本:格式化的V$SQL_SHARED_CURSOR报告
脚本:监控并行进程状态
脚本:监控数据库中的活跃用户及其运行的SQL
脚本:监控临时表空间使用率
Script to show Active Distributed Transactions
Gather DBMS_STATS Default parameter
Script:Datafile Report
Script to Collect Data Guard Diagnostic Information
Script:To Report Information on Indexes
ORA-4031 Common Analysis/Diagnostic Scripts
Script:when transaction will finish rollback
Script: Computing Table Size
Script to Detect Tablespace Fragmentation
“hcheck.sql” script to check for known problems in Oracle8i, Oracle9i, Oracle10g and Oracle 11g
Script to Prevent Excessive Spill of Message From the Streams Buffer Queue To Disk
Oracle Systemstate dump analytic tool: ASS.AWK V1.09
SCRIPT TO GENERATE SQL*LOADER CONTROL FILE


Script:收集RAC诊断信息

以下脚本可以用于汇总RAC诊断信息, 并非每一个输出或者每一个日志都要阅读,在问题诊断时可以有针对性地查看, 如果是远程协助的会,可以让用户收集完打包 ,这样省去多次交互的时间:


      - Cluster 启动状态
   - hostname
   - uptime 
   - vmstat iostat nmon OS stats 
   - /etc/sysctl.conf /etc/system  vmo -a no -a 
   - /etc/inittab
   - /etc/init.d/init.crs
   - /etc/init.d/init.crsd
   - /etc/init.d/init.cssd
   - /etc/init.d/init.evmd
   - olsnodes
   - crsctl check css
   - crsctl check crs status
   - crsctl check crsd status
   - crsctl check cssd status
   - crsctl check evmd status
   - crsctl query css votedisk
   - crsctl get css priority
   - crsctl get css diagwait
   - crsctl get css disktimeout
   - crsctl get css misscount
   - crsctl get css reboottime
   - crsctl query crs softwareversion
   - crsctl query crs activeversion
   - opatch lsinventory -detail 
   - /var/opt/oracle/ocr.loc 或 /etc/oracle/ocr.loc
   - cluvfy comp sys -n <hostname> -p crs -verbose
   - cluvfy comp sys -n <hostname> -p databaase -verbose
   - cluvfy stage -post crsinst -n <hostname> -verbose
   - cluvfy comp software -verbose -n all
   - Clusterware 版本
   - $ORA_CRS_HOME 已安装产品的信息
   - $ORA_CRS_HOME 已应用补丁的信息
   - crs_stat -u
   - crs_stat -p
   - $ORA_CRS_HOME/log/<hostname>/alert<hostname>.log
   - $ORA_CRS_HOME/crs/log/*.log
   - $ORA_CRS_HOME/log/<hostname>/crsd/*
   - $ORA_CRS_HOME/css/log/*.log
   - $ORA_CRS_HOME/css/init/*.log
   - $ORA_CRS_HOME/log/<hostname>/cssd/*
   - $ORA_CRS_HOME/racg/dump/*
   - $ORACLE_HOME/racg/dump/*
   - $ORA_CRS_HOME/log/<hostname>/racg/*
   - $ORACLE_HOME/log/<hostname>/racg/*
   - $ORA_CRS_HOME/evm/log/*.log
   - $ORA_CRS_HOME/evm/init/*.log
   - $ORA_CRS_HOME/log/<hostname>/evmd/*
   - $ORA_CRS_HOME/log/<hostname>/client/*
   - $ORACLE_HOME/log/<hostname>/client/*
   - $ORA_CRS_HOME/log/<hostname>/ohasd/ohasd.log
   - $ORA_CRS_HOME/log/<hostname>/gpnpd/gpnpd.log
   - /etc/oracle/oprocd/*oprocd.log 或 /var/opt/oracle/oprocd/*oprocd.log
   - /etc/oracle/lastgasp/*.lgl 或  /var/opt/oracle/lastgasp/*.lgl
   - debug resource
  # cd $ORA_CRS_HOME/bin
  # crsctl debug log res <resname:level>
  # crsctl debug log res <vip resourfce name>:5
   - ocrdump
   - ocrcheck
   - ocrconfig -showbackup
   - /var/opt/oracle/srvConfig.loc 或 /etc/srvConfig.loc
   - srvctl config nodeapps -n <hostname> -a -l -g -s
   - srvctl config
   - srvctl config database -d <dbname> -a
   - srvctl config scan_listener
   - srvctl status scan_listener
   - srvctl config scan
   - srvctl status scan
   - srvctl config srvpool
   - srvctl status srvpool -a
   - srvctl config listener
   - srvctl status listener
   - srvctl config listener -n <hostname>
   - oifcfg iflist
   - oifcfg getif
   - interconnect 信息 x$skgxpia or oradebug ipc
   - IPC 信息
   - messages 或 syslog OS日志 
   IBM: /bin/errpt -a > messages.out
      Linux: /var/log/messages
      Solaris: /var/adm/messages

   - netstat -rn
   - ifconfig -a
   - cat /etc/hosts
   - netstat -s

Script:收集自动SGA内存管理ASMM诊断信息

以下脚本可以用于收集自动SGA(sga_target>0)内存管理ASMM下的实例诊断信息:


spool auto_sga_diag.log 

set line 190 pagesize 1400

 SELECT a.SGA_MEM + b.PGA_MEM "TOTAL_MEMORY"
    FROM (SELECT SUM(current_size) / 1024 / 1024 "SGA_MEM"
            FROM v$sga_dynamic_components,
                 (SELECT SUM(pga_alloc_mem) / 1024 / 1024 "PGA_MEM"
                    FROM v$process) a
           WHERE component IN ('shared pool',
                               'large pool',
                               'java pool',
                               'streams pool',
                               'DEFAULT buffer cache')) a,
         (SELECT SUM(pga_alloc_mem) / 1024 / 1024 "PGA_MEM" FROM v$process) b;

select component,
       current_size / 1024 / 1024 "CURRENT_SIZE",
       min_size / 1024 / 1024 "MIN_SIZE",
       user_specified_size / 1024 / 1024 "USER_SPECIFIED_SIZE",
       last_oper_type "TYPE"
  from v$sga_dynamic_components;

select component, granule_size / 1024 / 1024 "GRANULE_SIZE(Mb)"
  from v$sga_dynamic_components;

col component for a25
col status format a10 head "Status"
col initial_size for 999,999,999,999 head "Initial"
col parameter for a25 heading "Parameter"
col final_size for 999,999,999,999 head "Final"
col changed head "Changed At"
col low format 999,999,999,999 head "Lowest"
col high format 999,999,999,999 head "Highest"
col lowMB format 999,999 head "MBytes"
col highMB format 999,999 head "MBytes"

SELECT component,
       parameter,
       initial_size,
       final_size,
       status,
       to_char(end_time, 'mm/dd/yyyy hh24:mi:ss') changed
  FROM v$sga_resize_ops
 ORDER BY component;

SELECT component,
       min(final_size) low,
       (min(final_size / 1024 / 1024)) lowMB,
       max(final_size) high,
       (max(final_size / 1024 / 1024)) highMB
  FROM v$sga_resize_ops
 GROUP BY component
 ORDER BY component;

SELECT name, bytes FROM v$sgainfo;

select * from v$sgastat order by bytes asc;

select name, trunc(bytes / 1024 / 1024, 2) "size(MB)"
  from v$sgastat
 where pool is null
union
select pool, trunc(sum(bytes) / 1024 / 1024, 2) "size(MB)"
  from v$sgastat
 where pool is not null
 group by pool;

 select * from V$SGA_CURRENT_RESIZE_OPS;

 select * from v$sga_target_advice;

show parameter size
show parameter statistics        

spool off;

Script:Collect vip resource Diagnostic Information

以下脚本可以用于收集 Oracle RAC中vip 资源或其他CRS resource的诊断信息:


action plan:

./runcluvfy.sh stage -post crsinst -n all  -verbose

./runcluvfy.sh stage -pre crsinst -n all  -verbose

or


cluvfy stage -post crsinst -n all -verbose

cluvfy stage -pre  crsinst -n all -verbose

1. Please upload the following logs of all two nodes:
$CRS_HOME/log/<nodename>/*.log
$CRS_HOME/log/<nodename>/crsd/*.log
$CRS_HOME/log/<nodename>/cssd/*.log
$CRS_HOME/log/<nodename>/racg/*.log
$CRS_HOME/log/<nodename>/client/*.log
$CRS_HOME/log/<nodename>/evmd/*.log

/etc/oracle/oprocd/*.log.* or /var/opt/oracle/oprocd/*.log.* (If have)

$crs_stat –t
$crsctl check crs
$crsctl check boot

2. 

Please consult your sysadmin and make sure that the gateway is pingable all the time 

1- test the gw on every node
consult your sysadmin to create a crontab unix shell script to ping the
gateway of your public interface every 2 seconds for example and the result is to be
spooled in /tmp/test_gw_<nodename>.log

ping your gateway  and upload the ping log 

2- increase the tracing level of the vip resource  
  as root user
  # cd $ORA_CRS_HOME/bin
  # crsctl debug log res <resname:level>
  # crsctl debug log res <vip resourfce name>:5

3- restart the clusterware

3- execute this test on both nodes at the same time
   $ script /tmp/testvip_<nodename>.log
   $ cd $ORA_CRS_HOME/bin
   $ hostname
   $ date
   $ cat /etc/hosts
   $ ifconfig -a
   $ oifcfg getif  
   $ netstat -rn

   $ oifcfg iflist
   $ srvctl config nodeapps -n <nodename> -a -g -s -l               (repeate it for all nodes)

   $ crs_stat –t
   $ exit

4- reset the tracing level of the vip resource  
  as root user
  # cd $ORA_CRS_HOME/bin
  # crsctl debug log res <resname:level>
  # crsctl debug log res <vip resourfce name>:1

Up on the next occurence, please upload the following information from all nodes

  a-  /tmp/test_gw_<nodename>.log
  b- /tmp/testvip_<nodename>.log
  c- the crsd log
  d. The resource racg
     $ORA_CRS_HOME/log/<nodename>/racg/vip*

  e. the racgvip script from
     $ORA_CRS_HOME/bin/racgvip
  f- RDA from all the nodes
    Note 314422.1 Remote Diagnostic Agent (RDA) 4.0 – Overview

   g- the o/s message file
      IBM: /bin/errpt -a > messages.out
      Linux: /var/log/messages
      Solaris: /var/adm/messages

3. CRS Diagnostics

note 330358.1 -- CRS Diagnostic Collection Guide, please use (all .gz files especially crsData_$HOST.tar.gz
need to be uploaded)

diagcollection.pl --collect 

Please make sure to include *ALL* requested files (missing any will delay or prevendting from
identifying root cause) from *ALL* nodes in a single zip and upload.

Note 330358.1 - CRS 10gR2/ 11gR1/ 11gR2 Diagnostic Collection Guide       
Note 298895.1 - Modifying the default gateway address used by the Oracle 10g VIP
Note 399213.1 - VIP Going Offline Intermittantly - Slow Response from Default Gateway
Note 401783.1 - Changes in Oracle Clusterware after applying 10.2.0.3 Patchset

11g新特性:hangdiag.sql实例hang诊断脚本

11g中引入了hangdiag.sql 这个脚本来帮助Oracle Support 用来收集诊断实例hang住所需要的diagnostic信息,这个脚本直接存放在11g 以后的$ORACLE_HOME/rdbms/admin目录下,无需用户另外下载。


该脚本用于收集单实例的hang诊断信息还是很不错的,如果是RAC环境的话推荐使用racdiag.sql这个脚本。


值得一提的是 hangdiag.sql会做 11g中独有的(oradebug dump hangdiag_header 1)并将v$wait_chain的源信息x$ksdhng_chains文本形式输出, 之后会做ashdump和systemstate(level 267 可能耗时较长)的dump转储操作,这样获得的trace文件信息就很全面了。


hangdiag.sql:


[oracle@vrh2 ~]$ cat $ORACLE_HOME/rdbms/admin/hangdiag.sql
Rem
Rem $Header: hangdiag.sql 08-jun-2007.02:06:43 amysoren Exp $
Rem
Rem hangdiag.sql
Rem
Rem Copyright (c) 2007, Oracle. All rights reserved.  
Rem
Rem    NAME
Rem      hangdiag.sql - Hang Diagnosis script
Rem
Rem    DESCRIPTION
Rem      It is generally useful (but not necessary) to run this script from a
Rem      prelim mode connection.
Rem
Rem      This script dumps data required to diagnose hangs:
Rem      1. ASH dump
Rem      2. Systemstate dump with short callstacks
Rem      3. Hang analysis results (x$ksdhng_chains)
Rem
Rem    NOTES
Rem      It is required to set PID using oradebug setmypid/setospid/setorapid
Rem      before invoking this script. 
Rem
Rem      "oradebug tracefile_name" gives the file name including the path of
Rem      the trace file containing the dumps.
Rem
Rem
Rem    MODIFIED   (MM/DD/YY)
Rem    amysoren    06/08/07 - direct_access command syntax change
Rem    avaliani    05/17/07 - bug 5499564: add x$ksdhng_chains
Rem    amysoren    01/10/07 - add ashdump, systemstate dump
Rem    amysoren    01/10/07 - Created
Rem

-- begin hang diag dump
oradebug dump hangdiag_header 1

-- dump hang analysis chains
oradebug direct_access enable trace
oradebug direct_access disable reply
oradebug direct_access set content_type = 'text/plain'
oradebug direct_access select * from x$ksdhng_chains

-- dump ash data
oradebug dump ashdump 5

-- dump systemstate with short callstacks
oradebug dump systemstate 267

x$ksdhng_chains内部视图的字段如下

SQL> desc x$ksdhng_chains;
 Name                                      Null?    Type
 ----------------------------------------- -------- ----------------------------
 ADDR                                               RAW(8)
 INDX                                               NUMBER
 INST_ID                                            NUMBER
 CHAIN_ID                                           NUMBER
 CHAIN_IS_CYCLE                                     NUMBER
 CHAIN_SIGNATURE                                    VARCHAR2(801)
 CHAIN_SIGNATURE_HASH                               NUMBER
 INSTANCE                                           NUMBER
 OSID                                               VARCHAR2(25)
 PID                                                NUMBER
 SID                                                NUMBER
 SESS_SERIAL#                                       NUMBER
 BLOCKER_IS_VALID                                   NUMBER
 BLOCKER_INSTANCE                                   NUMBER
 BLOCKER_OSID                                       VARCHAR2(25)
 BLOCKER_PID                                        NUMBER
 BLOCKER_SID                                        NUMBER
 BLOCKER_SESS_SERIAL#                               NUMBER
 BLOCKER_CHAIN_ID                                   NUMBER
 IN_WAIT                                            NUMBER
 TIME_SINCE_LAST_WAIT_SECS                          NUMBER
 WAIT_ID                                            NUMBER
 WAIT_EVENT                                         NUMBER
 WAIT_EVENT_TEXT                                    VARCHAR2(64)
 P1                                                 NUMBER
 P1_TEXT                                            VARCHAR2(64)
 P2                                                 NUMBER
 P2_TEXT                                            VARCHAR2(64)
 P3                                                 NUMBER
 P3_TEXT                                            VARCHAR2(64)
 IN_WAIT_SECS                                       NUMBER
 TIME_REMAINING_SECS                                NUMBER
 NUM_WAITERS                                        NUMBER
 ROW_WAIT_OBJ#                                      NUMBER
 ROW_WAIT_FILE#                                     NUMBER
 ROW_WAIT_BLOCK#                                    NUMBER
 ROW_WAIT_ROW#                                      NUMBER


使用范例如下:


SQL> select * from v$version;

BANNER
--------------------------------------------------------------------------------
Oracle Database 11g Enterprise Edition Release 11.2.0.3.0 - 64bit Production
PL/SQL Release 11.2.0.3.0 - Production
CORE    11.2.0.3.0      Production
TNS for Linux: Version 11.2.0.3.0 - Production
NLSRTL Version 11.2.0.3.0 - Production

SQL> select * from global_name;

GLOBAL_NAME
--------------------------------------------------------------------------------
www.askmac.cn & www.askmac.cn  

SQL> oradebug setmypid;
Statement processed.
SQL>
SQL>
SQL> @?/rdbms/admin/hangdiag    
Statement processed.
SQL> oradebug tracefile_name;
/s01/orabase/diag/rdbms/vprod/VPROD2/trace/VPROD2_ora_22612.trc

Sample output 示例输出如下:

Processing Oradebug command 'setmypid'

Oradebug command 'setmypid' console output: <none>

Processing Oradebug command 'dump hangdiag_header 1'
Hang diagnosis dumps

Oradebug command 'dump hangdiag_header 1' console output: <none>
Result of fixed table query: select * from x$ksdhng_chains
ADDR    = 7FA5333FDC08
INDX    = 0
INST_ID = 2
CHAIN_ID        = 1
CHAIN_IS_CYCLE  = 0
CHAIN_SIGNATURE = 'SQL*Net message from client'<='enq: TM - contention'
CHAIN_SIGNATURE_HASH    = 373050554
INSTANCE        = 2
OSID    = 26593
PID     = 47
SID     = 188
SESS_SERIAL#    = 1879
BLOCKER_IS_VALID        = 1
BLOCKER_INSTANCE        = 2
BLOCKER_OSID    = 25967
BLOCKER_PID     = 43
BLOCKER_SID     = 176
BLOCKER_SESS_SERIAL#    = 9631
BLOCKER_CHAIN_ID        = 0
IN_WAIT = 1
TIME_SINCE_LAST_WAIT_SECS       = 0
WAIT_ID = 8
WAIT_EVENT      = 234
WAIT_EVENT_TEXT = enq: TM - contention
P1      = 1414332422
P1_TEXT = name|mode
P2      = 79775
P2_TEXT = object #
P3      = 0
P3_TEXT = table/partition
IN_WAIT_SECS    = 692
TIME_REMAINING_SECS     = -1
NUM_WAITERS     = 0
ROW_WAIT_OBJ#   = 79775
ROW_WAIT_FILE#  = 0
ROW_WAIT_BLOCK# = 0
ROW_WAIT_ROW#   = 0

ADDR    = 7FA5333FDC08
INDX    = 1
INST_ID = 2
CHAIN_ID        = 1
CHAIN_IS_CYCLE  = 0
CHAIN_SIGNATURE = 'SQL*Net message from client'<='enq: TM - contention'
CHAIN_SIGNATURE_HASH    = 373050554
INSTANCE        = 2
OSID    = 25967
PID     = 43
SID     = 176
SESS_SERIAL#    = 9631
BLOCKER_IS_VALID        = 0
BLOCKER_INSTANCE        = 0
BLOCKER_OSID    =
BLOCKER_PID     = 0
BLOCKER_SID     = 0
BLOCKER_SESS_SERIAL#    = 0
BLOCKER_CHAIN_ID        = 0
IN_WAIT = 1
TIME_SINCE_LAST_WAIT_SECS       = 0
WAIT_ID = 148
WAIT_EVENT      = 352
WAIT_EVENT_TEXT = SQL*Net message from client
P1      = 1650815232
P1_TEXT = driver id
P2      = 1
P2_TEXT = #bytes
P3      = 0
P3_TEXT =
IN_WAIT_SECS    = 568
TIME_REMAINING_SECS     = -1
NUM_WAITERS     = 1
ROW_WAIT_OBJ#   = -1
ROW_WAIT_FILE#  = 0
ROW_WAIT_BLOCK# = 0
ROW_WAIT_ROW#   = 0

2 rows selected

Processing Oradebug command 'dump ashdump 5'
ASH dump
<<<ACTIVE SESSION HISTORY - PROCESS TRACE DUMP HEADER BEGIN>>>
****************
SCRIPT TO IMPORT
****************
------------------------------------------
Step 1: Create destination table <ashdump>
------------------------------------------
CREATE TABLE ashdump AS
SELECT * FROM SYS.WRH$_ACTIVE_SESSION_HISTORY WHERE rownum < 0
----------------------------------------------------------------
Step 2: Create the SQL*Loader control file <ashldr.ctl> as below
----------------------------------------------------------------
load data
infile * "str '\n####\n'"
append
into table ashdump
fields terminated by ',' optionally enclosed by '"'
(
SNAP_ID  CONSTANT 0           ,
DBID                          ,
INSTANCE_NUMBER               ,
SAMPLE_ID                     ,
SAMPLE_TIME TIMESTAMP ENCLOSED BY '"' AND '"' "TO_TIMESTAMP(:SAMPLE_TIME   ,'MM-DD-YYYY HH24:MI:SSXFF')"   ,
SESSION_ID                    ,
SESSION_SERIAL#               ,
SESSION_TYPE                  ,
USER_ID                       ,
SQL_ID                        ,
SQL_CHILD_NUMBER              ,
SQL_OPCODE                    ,
FORCE_MATCHING_SIGNATURE      ,
TOP_LEVEL_SQL_ID              ,
TOP_LEVEL_SQL_OPCODE          ,
SQL_PLAN_HASH_VALUE           ,
SQL_PLAN_LINE_ID              ,
SQL_PLAN_OPERATION#           ,
SQL_PLAN_OPTIONS#             ,
SQL_EXEC_ID                   ,
SQL_EXEC_START DATE 'MM/DD/YYYY HH24:MI:SS' ENCLOSED BY '"' AND '"' ":SQL_EXEC_START"   ,
PLSQL_ENTRY_OBJECT_ID         ,
PLSQL_ENTRY_SUBPROGRAM_ID     ,
PLSQL_OBJECT_ID               ,
PLSQL_SUBPROGRAM_ID           ,
QC_INSTANCE_ID                ,
QC_SESSION_ID                 ,
QC_SESSION_SERIAL#            ,
EVENT_ID                      ,
SEQ#                          ,
P1                            ,
P2                            ,
P3                            ,
WAIT_TIME                     ,
TIME_WAITED                   ,
BLOCKING_SESSION              ,
BLOCKING_SESSION_SERIAL#      ,
BLOCKING_INST_ID              ,
CURRENT_OBJ#                  ,
CURRENT_FILE#                 ,
CURRENT_BLOCK#                ,
CURRENT_ROW#                  ,
TOP_LEVEL_CALL#               ,
CONSUMER_GROUP_ID             ,
XID                           ,
REMOTE_INSTANCE#              ,
TIME_MODEL                    ,
SERVICE_HASH                  ,
PROGRAM                       ,
MODULE                        ,
ACTION                        ,
CLIENT_ID                     ,
MACHINE                       ,
PORT                          ,
ECID
)
---------------------------------------------------
Step 3: Load the ash rows dumped in this trace file
---------------------------------------------------
sqlldr userid/password control=ashldr.ctl data=<this_trace_filename> errors=1000000
---------------------------------------------------
<<<ACTIVE SESSION HISTORY - PROCESS TRACE DUMP HEADER END>>>
<<<ACTIVE SESSION HISTORY - PROCESS TRACE DUMP BEGIN>>>
####
881465081,2,2082369,"01-10-2012 00:49:06.871520000",188,1879,1,0,"562cub3hk2tjy",
0,26,0,"",0,0,0,0,0,33554433,"01/10/2012 00:37:27",0,0,0,0,0,0,0,668627480,9,1414332422,
79775,0,0,0,176,9631,2,79775,0,0,0,94,12553,,0,1024,3427055676,"sqlplus@vrh2.oracle.com (TNS V1-V3)",
"sqlplus@vrh2.oracle.com (TNS V1-V3)","","","vrh2.oracle.com",0,""
.......................................

Processing Oradebug command 'dump systemstate 267'
===================================================
SYSTEM STATE (level=11, with short stacks)
------------
System global information:
.............................
call stack performance statistics:
total                  : 0.030000 sec              
setup                  : 0.000000 sec              
stack unwind           : 0.000000 sec              
symbol translation     : 0.030000 sec
printing the call stack: 0.000000 sec              
printing frame data    : 0.000000 sec              
printing argument data : 0.000000 sec              
----- End of Call Stack Trace -----


好了 , 就这么简单, 把trace文件打个zip包传到 My Oracle Support上去吧, 当然你也可以找我!我叫 Maclean.Liu!

利用rowid分块实现非分区表的并行update与delete

大表中海量历史数据的更新与删除一直是令DBA非常头痛的事情,在表已经分区的前提下我们还可以利用并行或者truncate parition等手段来为UPDATE或者DELETE提速, 但是如果对象是普通的非分区对表(non-partitioned heap table)的话,似乎就没有太好的加速方法了, nologging或parallel 对非分区表都没有效果。


之前我也有介绍过一个利用rowid将非分区表分割成指定数量个区间块的方法,见<Script:partition table into rowid extent chunks>;利用该脚本可以获取到这些分割后的区间块的起始rowid和结尾rowid,之后利用between start_rowid and end_rowid的条件构造多条DML语句, 因为这些DML语句所更新的数据都是在互不相关的区间内的,所以可以在多个终端内并行地运行这些DML语句,而不会造成锁的争用或者Oracle并行执行协调(Parallel Execution coordinator ) 所带来的一些开销。


为了加深理解,我们来实践一下<Script:partition table into rowid extent chunks>中提到的方法:


SQL> select * from v$version;

BANNER
----------------------------------------------------------------
Oracle Database 10g Enterprise Edition Release 10.2.0.1.0 - 64bi
PL/SQL Release 10.2.0.1.0 - Production
CORE    10.2.0.1.0      Production
TNS for Linux: Version 10.2.0.1.0 - Production
NLSRTL Version 10.2.0.1.0 - Production

SQL> select * from global_name;

GLOBAL_NAME
--------------------------------------------------------------------------------
www.askmac.cn & www.askmac.cn

SQL> select count(*) from order_history;

  COUNT(*)
----------
   1137523

order_history 是一张非分区表, 存有100w条记录

SQL> select count(*) from order_history where order_id<1999999;

  COUNT(*)
----------
    499999


假设我们要删除order_history上order_id<1999999的所有记录, 占到总行数的50%。由于order_history是非分区表,所以这里无法用Oracle的并行执行Parallel Execution来加速操作。  因此我们利用上述脚本来构造多条DML语句:


SQL> @rowid_chunk

Enter value for rowid_ranges: 24             ==>这里输入要构造的rowid分区个数

Enter value for segment_name: ORDER_HISTORY  ==> 输入表名

Enter value for owner: SYS                   ==> owner名

where rowid between 'AAANJFAAEAAEXlBAAA' and 'AAANJFAAEAAEYjdCcP';
where rowid between 'AAANJFAAEAAEYjeAAA' and 'AAANJFAAEAAEZDdCcP';
where rowid between 'AAANJFAAEAAEZDeAAA' and 'AAANJFAAEAAEZhdCcP';
where rowid between 'AAANJFAAEAAEZheAAA' and 'AAANJFAAEAAEaBdCcP';
where rowid between 'AAANJFAAEAAEaBeAAA' and 'AAANJFAAEAAEahdCcP';
where rowid between 'AAANJFAAEAAEaheAAA' and 'AAANJFAAEAAEa3dCcP';
where rowid between 'AAANJFAAEAAEa3eAAA' and 'AAANJFAAEAAEbfdCcP';
where rowid between 'AAANJFAAEAAEbfeAAA' and 'AAANJFAAEAAEbzdCcP';
where rowid between 'AAANJFAAEAAEbzeAAA' and 'AAANJFAAEAAEcbdCcP';
where rowid between 'AAANJFAAEAAEcbeAAA' and 'AAANJFAAEAAEcvdCcP';
where rowid between 'AAANJFAAEAAEcveAAA' and 'AAANJFAAEAAEdXdCcP';
where rowid between 'AAANJFAAEAAEdXeAAA' and 'AAANJFAAEAAEdrdCcP';
where rowid between 'AAANJFAAEAAEdreAAA' and 'AAANJFAAEAAEeTdCcP';
where rowid between 'AAANJFAAEAAEeTeAAA' and 'AAANJFAAEAAEe5dCcP';
where rowid between 'AAANJFAAEAAEe5eAAA' and 'AAANJFAAEAAEfNdCcP';
where rowid between 'AAANJFAAEAAEfNeAAA' and 'AAANJFAAEAAEf1dCcP';
where rowid between 'AAANJFAAEAAEf1eAAA' and 'AAANJFAAEAAEgJdCcP';
where rowid between 'AAANJFAAEAAEgJeAAA' and 'AAANJFAAEAAEgxdCcP';
where rowid between 'AAANJFAAEAAEgxeAAA' and 'AAANJFAAEAAEhZdCcP';
where rowid between 'AAANJFAAEAAEhZeAAA' and 'AAANJFAAEAAEhtdCcP';
where rowid between 'AAANJFAAEAAEhteAAA' and 'AAANJFAAEAAEiVdCcP';
where rowid between 'AAANJFAAEAAEiVeAAA' and 'AAANJFAAEAAEi1dCcP';
where rowid between 'AAANJFAAEAAEi1eAAA' and 'AAANJFAAEAAEjVdCcP';
where rowid between 'AAANJFAAEAAEjVeAAA' and 'AAANJFAAEAAEjldCcP';


以上我们利用脚本构造出来24个由rowid标示的分区块(chunks),相当于我们人为地将一张非分区表划分成24个区域,每个区域都互不重叠,利用rowid做分界线。尝试利用上面获取到的条件condition来构造DML:


UPDATE OR DELETE
where rowid between ‘start_rowid’ and ‘end_rowid’ AND  其他条件


例如要删除非分区表上所有order_id<1999999;的记录,如不优化则是一条语句:


DELETE FROM ORDER_HISTORY where order_id<1999999;
COMMIT;


实际在很大的表上这样删除数据是不理想也不可行的,几点理由:

1.  单条SQL语句串行执行,速度缓慢
2.  运行时间过长可能引发ORA-1555等著名错误
3.  如果失败rollback回滚可能是一场灾难


若利用我这里介绍的方法, 则可以构造出多条DML语句并行删除,每一条均只删除一小部分:


DELETE  FROM ORDER_HISTORY where rowid between ‘AAANJFAAEAAEXlBAAA’ and ‘AAANJFAAEAAEYjdCcP’  and order_id<1999999;
COMMIT;
DELETE  FROM ORDER_HISTORY where rowid between ‘AAANJFAAEAAEYjeAAA’ and ‘AAANJFAAEAAEZDdCcP’ and order_id<1999999;
COMMIT;
DELETE  FROM ORDER_HISTORY where rowid between ‘AAANJFAAEAAEZDeAAA’ and ‘AAANJFAAEAAEZhdCcP’ and order_id<1999999;
COMMIT;
………………………………..


视乎你想要的并行度, 将以上构成DML语句再分割几块,打开多个终端同时执行。

这样做的几个优点:

1.  用户手动控制的并行执行,省去了Oracle Parallel并行控制的开销,使用得当的话比加parallel hint或者表上加并行度效率更高。
2. 将数据分割成小块(chunks)来处理,避免了ORA-1555错误
3. 用户可以根据主机负载和IO 动态地加减并行度


SQL> select count(*) from order_history where rowid between 'AAANJFAAEAAEXlBAAA' and 'AAANJFAAEAAEYjdCcP';

  COUNT(*)
----------
     84342

SQL> select count(*) from order_history where rowid between 'AAANJFAAEAAEYjeAAA' and 'AAANJFAAEAAEZDdCcP';

  COUNT(*)
----------
     49959

SQL> select count(*)
  2    from order_history
  3   where rowid between 'AAANJFAAEAAEXlBAAA' and 'AAANJFAAEAAEYjdCcP'
  4     and order_id < 1999999;

  COUNT(*)
----------
     84342

SQL> select count(*)
  2    from order_history
  3   where rowid between 'AAANJFAAEAAEYjeAAA' and 'AAANJFAAEAAEZDdCcP'
  4     and order_id < 1999999;

  COUNT(*)
----------
     49959

SQL> delete order_history
  2   where rowid between 'AAANJFAAEAAEXlBAAA' and 'AAANJFAAEAAEYjdCcP'
  3     and order_id < 1999999;

84342 rows deleted.

SQL> delete order_history
  2   where rowid between 'AAANJFAAEAAEYjeAAA' and 'AAANJFAAEAAEZDdCcP'
  3     and order_id < 1999999;

49959 rows deleted.

SQL>commit;

Commit complete


但是以上方法仍存在几点不足:

1. 《Script:partition table into rowid extent chunks》脚本目前不支持分区表
2.  因为《Script:partition table into rowid extent chunks》的脚本是根据表段的大小均匀地分割成指定数目的区域,试想当一些要更新或者删除的历史数据集中分布在segment的某些位置时(例如所要删除的数据均存放在一张表的前200个Extents中),因为脚本是根据大小均匀分割区域的,所以某些区域是根本没有我们所要处理的数据的,由这些区域构造出来的DML语句都是无意义的。


基于以上这些考虑,我重写了获取rowid分块的SQL脚本,如下:


REM   put it in GUI TOOLS! otherwise caused ORA-00933
REM   control commit yourself, avoid ORA-1555

select 'and rowid between ''' || ora_rowid || ''' and ''' ||
       lead(ora_rowid, 1) over(order by rn asc) || '''' || ';'
  from (

       with cnt as (select count(*) from order_history)             -- 注意替换这里!!
         select rn, ora_rowid
           from (select rownum rn, ora_rowid
                   from (select rowid ora_rowid
                           from order_history                       -- 注意替换这里!!
                          order by rowid))
          where rn in (select (rownum - 1) *
                              trunc((select * from cnt) / &row_range) + 1
                         from dba_tables
                        where rownum < &row_range                  --输入分区的数目
                       union
                       select * from cnt))

and rowid between AAANJFAAEAAEZELAAB and AAANJFAAEAAEaRaABm
and rowid between AAANJFAAEAAEaRaABm and AAANJFAAEAAEbi+ABu
and rowid between AAANJFAAEAAEbi+ABu and AAANJFAAEAAEc0iAB2
and rowid between AAANJFAAEAAEc0iAB2 and AAANJFAAEAAEeGHAAG
and rowid between AAANJFAAEAAEeGHAAG and AAANJFAAEAAEfVrAAO
and rowid between AAANJFAAEAAEfVrAAO and AAANJFAAEAAEgnPAAW
and rowid between AAANJFAAEAAEgnPAAW and AAANJFAAEAAEjQIAB2
and rowid between AAANJFAAEAAEjQIAB2 and


以上脚本同样可以实现rowid分区的目的,但是因为其rowid是直接取自SELECT语句查询,所以不存在不支持分区表等复杂对象的情况。 也因为rowid是来源于SELECT,所以我们可以指定针对那些存在符合条件数据的范围分区。


例如我们希望仅针对存有满足order_id<1999999条件数据的范围rowid分块,那么将replace here的地方替换成你的条件:


select 'and rowid between ''' || ora_rowid || ''' and ''' ||
       lead(ora_rowid, 1) over(order by rn asc) || '''' || ';'
  from (

       with cnt as (select count(*)
                      from order_history
                     where order_id < 1999999) -- replace here
         select rn, ora_rowid
           from (select rownum rn, ora_rowid
                   from (select rowid ora_rowid
                           from order_history
                          where order_id < 1999999 -- replace here
                          order by rowid))
          where rn in (select (rownum - 1) *
                              trunc((select * from cnt) / &row_range) + 1
                         from dba_tables
                        where rownum < &row_range
                       union
                       select * from cnt))

and rowid between 'AAANJFAAEAAEZELAAB' and 'AAANJFAAEAAEZf7ABd';
and rowid between 'AAANJFAAEAAEZf7ABd' and 'AAANJFAAEAAEZ9uABB';
and rowid between 'AAANJFAAEAAEZ9uABB' and 'AAANJFAAEAAEaXhAB2';
and rowid between 'AAANJFAAEAAEaXhAB2' and 'AAANJFAAEAAEa3dABW';
and rowid between 'AAANJFAAEAAEa3dABW' and 'AAANJFAAEAAEbTVAA2';
and rowid between 'AAANJFAAEAAEbTVAA2' and 'AAANJFAAEAAEbzRAAW';
and rowid between 'AAANJFAAEAAEbzRAAW' and 'AAANJFAAEAAEcyIAB2';
and rowid between 'AAANJFAAEAAEcyIAB2' and '';

SQL> select order_id from order_history where rowid='AAANJFAAEAAEZELAAB';

  ORDER_ID
----------
    538672

SQL>  select order_id from order_history where rowid='AAANJFAAEAAEcyIAB2';

  ORDER_ID
----------
   1994752

DELETE ORDER_HISTORY WHERE ORDER_ID<1999999 and rowid between 'AAANJFAAEAAEZELAAB' and 'AAANJFAAEAAEZf7ABd';
DELETE ORDER_HISTORY WHERE ORDER_ID<1999999 and rowid between 'AAANJFAAEAAEZf7ABd' and 'AAANJFAAEAAEZ9uABB';
DELETE ORDER_HISTORY WHERE ORDER_ID<1999999 and rowid between 'AAANJFAAEAAEZ9uABB' and 'AAANJFAAEAAEaXhAB2';
DELETE ORDER_HISTORY WHERE ORDER_ID<1999999 and rowid between 'AAANJFAAEAAEaXhAB2' and 'AAANJFAAEAAEa3dABW';
DELETE ORDER_HISTORY WHERE ORDER_ID<1999999 and rowid between 'AAANJFAAEAAEa3dABW' and 'AAANJFAAEAAEbTVAA2';
DELETE ORDER_HISTORY WHERE ORDER_ID<1999999 and rowid between 'AAANJFAAEAAEbTVAA2' and 'AAANJFAAEAAEbzRAAW';
DELETE ORDER_HISTORY WHERE ORDER_ID<1999999 and rowid between 'AAANJFAAEAAEbzRAAW' and 'AAANJFAAEAAEcyIAB2';

45713 rows deleted.

SQL>
45712 rows deleted.

SQL>
45712 rows deleted.

SQL>
45712 rows deleted.

SQL>
45712 rows deleted.

SQL>
45712 rows deleted.

SQL> 

91425 rows deleted.

SQL> SQL>
SQL>
SQL>
SQL> commit;

Commit complete.

SQL>
SQL>
SQL> select count(*) from ORDER_HISTORY WHERE ORDER_ID<1999999;

  COUNT(*)
----------
         0


几点注意事项:

1. 请将该脚本放到Pl/SQL Developer或Toad之类的工具中运行,在sqlplus中运行可能出现ORA-00933
2.  不要忘记替换红色标记的replace here的条件
3. 自行控制commit 避免出现ORA-1555错误


该脚本目前存在一个不足,在获取rowid分块时要求大表上有适当的索引,否则可能会因为全表扫描并排序而十分缓慢,若有恰当的索引则会使用INDEX FAST FULL SCAN。 这里的恰当索引是指至少有一个非空列的普通b*tree索引, 最好的情况是有主键索引或者bitmap位图索引。


Oracle在版本11.2中引入了DBMS_PARALLEL_EXECUTE 的新特性来帮助更新超大表,文档<11.2 New Feature : Using DBMS_PARALLEL_EXECUTE to Update Large Tables in Parallel [ID 1066555.1]>对该特性做了介绍。


该DBMS_PARALLEL_EXECUTE新特性的一大亮点就是 可以对表上的行数据进行分组为更小的块(chunks), 且并行更新这些小的块:


dbmspexe.sql – DBMS Parallel EXEcute package
This package contains APIs to chunk a table into smaller units and execute those chunks in parallel.

The DBMS_PARALLEL_EXECUTE package enables you to incrementally update the data in a large table in parallel, in two high-level steps:

  1. Group sets of rows in the table into smaller chunks.
  2. Apply the desired UPDATE statement to the chunks in parallel, committing each time you have finished processing a chunk.

This technique is recommended whenever you are updating a lot of data. Its advantages are:

  • You lock only one set of rows at a time, for a relatively short time, instead of locking the entire table.
  • You do not lose work that has been done if something fails before the entire operation finishes.
  • You reduce rollback space consumption.
  • You improve performance.


DBMS_PARALLEL_EXECUTE可以以3种方式将数据分块:


Different Ways to Spilt Workload

  1. CREATE_CHUNKS_BY_NUMBER_COL : Chunks the table associated with the given task by the specified column.
  2. CREATE_CHUNKS_BY_ROWID : Chunks the table associated with the given task by ROWID
  3. CREATE_CHUNKS_BY_SQL : Chunks the table associated with the given task by means of a user-provided SELECT statement


其中就包含了CREATE_CHUNKS_BY_ROWID这种按照ROWID分块的方式。


:) 这是一个来的有点迟的新特性(版本11.2才加入),迟到我们已经自行找到了多种原理类似的解决方案。 从另一个角度看, 用户的需求永远是那么正确, 是大量的用户在驱动着Oracle这个巨人!

Script:verify Oracle Object timestamp discrepancy

首先我们要知道这几个结构, 那就是


create table obj$                                            /* object table */
( obj#          number not null,                            /* object number */
  dataobj#      number,                          /* data layer object number */
  owner#        number not null,                        /* owner user number */
  name          varchar2("M_IDEN") not null,                  /* object name */
  namespace     number not null,         /* namespace of object (see KQD.H): */
 /* 1 = TABLE/PROCEDURE/TYPE, 2 = BODY, 3 = TRIGGER, 4 = INDEX, 5 = CLUSTER, */
                                                  /* 8 = LOB, 9 = DIRECTORY, */
  /* 10 = QUEUE, 11 = REPLICATION OBJECT GROUP, 12 = REPLICATION PROPAGATOR, */
                                     /* 13 = JAVA SOURCE, 14 = JAVA RESOURCE */
                                                 /* 58 = (Data Mining) MODEL */
  subname       varchar2("M_IDEN"),               /* subordinate to the name */
  type#         number not null,                 /* object type (see KQD.H): */
  /* 1 = INDEX, 2 = TABLE, 3 = CLUSTER, 4 = VIEW, 5 = SYNONYM, 6 = SEQUENCE, */
             /* 7 = PROCEDURE, 8 = FUNCTION, 9 = PACKAGE, 10 = NON-EXISTENT, */
              /* 11 = PACKAGE BODY, 12 = TRIGGER, 13 = TYPE, 14 = TYPE BODY, */
      /* 19 = TABLE PARTITION, 20 = INDEX PARTITION, 21 = LOB, 22 = LIBRARY, */
                                             /* 23 = DIRECTORY , 24 = QUEUE, */
    /* 25 = IOT, 26 = REPLICATION OBJECT GROUP, 27 = REPLICATION PROPAGATOR, */
    /* 28 = JAVA SOURCE, 29 = JAVA CLASS, 30 = JAVA RESOURCE, 31 = JAVA JAR, */
                 /* 32 = INDEXTYPE, 33 = OPERATOR , 34 = TABLE SUBPARTITION, */
                                                  /* 35 = INDEX SUBPARTITION */
                                                 /* 82 = (Data Mining) MODEL */
                                /* 92 = OLAP CUBE DIMENSION,  93 = OLAP CUBE */
                   /* 94 = OLAP MEASURE FOLDER, 95 = OLAP CUBE BUILD PROCESS */
  ctime         date not null,                       /* object creation time */
  mtime         date not null,                      /* DDL modification time */
 stime date not null, /* specification timestamp (version) */
  status        number not null,            /* status of object (see KQD.H): */
                                     /* 1 = VALID/AUTHORIZED WITHOUT ERRORS, */
                          /* 2 = VALID/AUTHORIZED WITH AUTHORIZATION ERRORS, */
                            /* 3 = VALID/AUTHORIZED WITH COMPILATION ERRORS, */
                         /* 4 = VALID/UNAUTHORIZED, 5 = INVALID/UNAUTHORIZED */

 create table dependency$                                 /* dependency table */
( d_obj#        number not null,                  /* dependent object number */
  d_timestamp   date not null,   /* dependent object specification timestamp */
  order#        number not null,                             /* order number */
  p_obj#        number not null,                     /* parent object number */
 p_timestamp date not null, /* parent object specification timestamp */
  d_owner#      number,                           /*  dependent owner number */
  property      number not null,                   /* 0x01 = HARD dependency */
                                                   /* 0x02 = REF  dependency */
                                          /* 0x04 = FINER GRAINED dependency */
  d_attrs       raw("M_CSIZ"), /* Finer grain attr. numbers if finer grained */
  d_reason      raw("M_CSIZ"))  /* Reason mask of attrs causing invalidation */


obj$ 和dependency$ 是2个基础的数据字典表:


obj$.stime的解释是specification timestamp (version),实际上这个字段代表了该对象的版本,指这个数据字典版本被创建的日期。
dependency$.p_timestamp代表依赖关系中父对象的数据字典版本被创建的日期。


例如STANDARD这个对象的STIME 字典版本的创建日期可能非常早:


SQL> select name,stime,ctime,mtime from sys.obj$ where name='STANDARD';

NAME                           STIME     CTIME     MTIME
------------------------------ --------- --------- ---------
STANDARD 18-APR-06 17-SEP-11 17-SEP-11
STANDARD                       17-SEP-11 17-SEP-11 17-SEP-11


注意若你的数据库是通过restore seed database(DBCA时选择非custom database)可能许多对象的stime=ctime。


有时候为了确保Oracle组件的正常,我们需要检验 父对象和依赖关系的数据字典版本是一致的,若不一致那么会导致组件对象失效(component object invalid)。


以下脚本可以列出数据库中所有父对象和依赖关系的数据字典版本是不一致的对象:


set pagesize 10000
column d_name format a20
column p_name format a20
select do.obj# d_obj,
       do.name d_name,
       do.type# d_type,
       po.obj# p_obj,
       po.name p_name,
       to_char(p_timestamp, 'DD-MON-YYYY HH24:MI:SS') "P_Timestamp",
       to_char(po.stime, 'DD-MON-YYYY HH24:MI:SS') "STIME",
       decode(sign(po.stime - p_timestamp), 0, 'SAME', '*DIFFER*') X
  from sys.obj$ do, sys.dependency$ d, sys.obj$ po
 where P_OBJ# = po.obj#(+)
   and D_OBJ# = do.obj#
   and do.status = 1 /*dependent is valid*/
   and po.status = 1 /*parent is valid*/
   and po.stime != p_timestamp /*parent timestamp not match*/
 order by 2, 1;

Script:SQL调优健康检查脚本

以下脚本可以用于收集SQL调优的相关信息,包括统计信息、优化器参数等。

When executed for one SQL_ID, this script generates an HTML report with the results of a set of health-checks around the one SQL statement provided. Health-checks are performed over:

  • CBO Statistics for schema objects accessed by the one SQL statement being analyzed
  • CBO Parameters
  • CBO System Statistics
  • CBO Data Dictionary Statistics
  • CBO Fixed-objects Statistics


下载sqlhc脚本


示例输出HTML:


Script:列出本会话的细节信息

以下脚本可以用于列出本会话(local session)的sid、pid、spid、trace 路径等有用信息; 因为不依赖于dbms_session等包体,所以仅需要select_catalog_role的角色即可执行,更为灵活。


set serveroutput on
set linesize 200 pagesize 1400
set time on
declare
  l_audsid number;
  l_sid    number;
  l_serial number;
  l_module varchar2(128);
  l_pid    number;
  l_spid   number;
  l_trace  varchar2(2000);
  l_user   varchar2(128);
begin
  DBMS_APPLICATION_INFO.SET_MODULE(module_name => 'Maclean Liu OppO',
                                   action_name => 'ACTIVE');
  select audsid, sid, SERIAL#, module,username
    into l_audsid, l_sid, l_serial, l_module,l_user
    from v$session
   where sid = (select distinct sid from v$mystat);
  select pid, spid
    into l_pid, l_spid
    from v$process
   where addr = (select paddr
                   from v$session
                  where sid = l_sid
                    and serial# = l_serial);
  SELECT d.VALUE || '/' || LOWER(RTRIM(i.INSTANCE, CHR(0))) || '_ora_' ||
         p.spid || '.trc'
    into l_trace
    FROM (SELECT p.spid
            FROM v$mystat m, v$session s, v$process p
           WHERE m.statistic# = 1
             AND s.SID = m.SID
             AND p.addr = s.paddr) p,
         (SELECT t.INSTANCE
            FROM v$thread t, v$parameter v
           WHERE v.NAME = 'thread'
             AND (v.VALUE = 0 OR t.thread# = TO_NUMBER(v.VALUE))) i,
         (SELECT VALUE FROM v$parameter WHERE NAME = 'user_dump_dest') d;

  dbms_output.enable(9999999);
  dbms_output.put_line('===============================================');
  dbms_output.put_line(' USERNAME=' || l_user);
  dbms_output.put_line(' SESSION ID=' || l_sid || '  SERIAL#=' || l_serial);
  dbms_output.put_line(' AUDSID=' || l_audsid || '      MODULE#=' ||
                       l_module);
  dbms_output.put_line(' PID=' || l_pid || '          SPID#=' || l_spid);
  dbms_output.put_line(' TRACE_FILE_LOCATION=' || l_trace);
  dbms_output.put_line('===============================================');
  commit;
end;
/

沪ICP备14014813号-2

沪公网安备 31010802001379号