Oracle中加速索引创建或重建的方法
View more documents from Maclean Liu
在10g中引入了数据泵Data Pump导入导出工具,DataPump的工作流如下图:
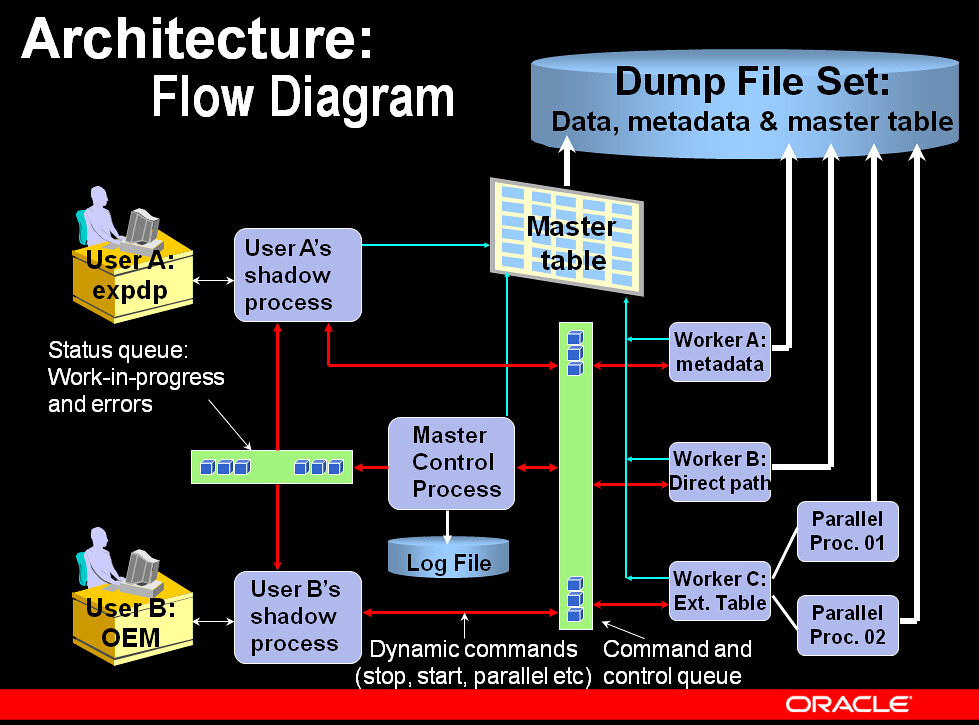
我们在使用Data Pump工具时经常会遇到著名的ORA-04031/ORA-04030错误,主要影响DataPump的内存组件有PGA和SGA中的共享池Shared Pool、流池Streams Pool。Expdp/Impdp对shared Pool的开销主要体现在其运行过程中需要调用一系列的包体PACKGE BODY,它们包括:
PACKAGE_NAME                             TYPE                 SHARABLE_MEM
---------------------------------------- -------------------- ------------
SYS.KUPM$MCP                             PACKAGE BODY               425448
SYS.KUPW$WORKER                          PACKAGE BODY               386000
SYS.DBMS_METADATA_INT                    PACKAGE BODY               325856
SYS.DBMS_REPCAT_UTL                      PACKAGE BODY               269064
SYS.DBMS_METADATA                        PACKAGE BODY               226624
SYS.DBMS_DATAPUMP                        PACKAGE BODY               192888
SYS.DBMS_PRVTAQIS                        PACKAGE BODY               147288
SYS.DBMS_PRVTAQIM                        PACKAGE BODY               142680
SYS.KUPF$FILE                            PACKAGE BODY               142008
SYS.DBMS_METADATA_UTIL                   PACKAGE BODY               115224
SYS.KUPD$DATA                            PACKAGE BODY               109400
SYS.DBMS_LOGREP_EXP                      PACKAGE BODY               102648
SYS.DBMS_SCHED_MAIN_EXPORT               PACKAGE BODY                86816
SYS.DBMS_SYS_SQL                         PACKAGE BODY                72280
SYS.DBMS_AW                              PACKAGE BODY                68128
SYS.DBMS_SQL                             PACKAGE BODY                68064
SYS.DBMS_DM_EXP_INTERNAL                 PACKAGE BODY                57040
SYS.DBMS_AW_EXP                          PACKAGE BODY                52256
SYS.KUPC$QUE_INT                         PACKAGE BODY                52088
SYS.DBMS_CUBE_EXP                        PACKAGE BODY                48432
SYS.KUPV$FT_INT                          PACKAGE BODY                47184
SYS.DBMS_LOGREP_UTIL                     PACKAGE BODY                45856
SYS.DBMS_CDC_EXPDP                       PACKAGE BODY                44616
SYS.DBMS_EXPORT_EXTENSION                PACKAGE BODY                38728
SYS.DBMS_CDC_UTILITY                     PACKAGE BODY                37712
SYS.KUPV$FT                              PACKAGE BODY                34536
SYS.DBMS_DM_MODEL_EXP                    PACKAGE BODY                33904
SYS.DBMS_AQ                              PACKAGE BODY                33512
SYS.DBMS_IJOB                            PACKAGE BODY                33488
SYS.DBMS_AQ_SYS_EXP_INTERNAL             PACKAGE BODY                29464
SYS.DBMS_FILE_GROUP_EXP                  PACKAGE BODY                29440
SYS.KUPD$DATA_INT                        PACKAGE BODY                29424
SYS.DBMS_RULE_EXP_RL_INTERNAL            PACKAGE BODY                29400
SYS.KUPP$PROC                            PACKAGE BODY                25368
SYS.DBMS_AQ_IMPORT_INTERNAL              PACKAGE BODY                25352
SYS.DBMS_AQADM                           PACKAGE BODY                25320
SYS.DBMS_ODCI                            PACKAGE BODY                21200
SYS.UTL_XML                              PACKAGE BODY                21200
SYS.DBMS_CDC_DPUTIL                      PACKAGE BODY                21192
SYS.DBMS_STREAMS_DATAPUMP_UTIL           PACKAGE BODY                21144
SYS.KUPF$FILE_INT                        PACKAGE BODY                17104
SYS.DBMS_SESSION                         PACKAGE BODY                17048
SYS.DBMS_AQ_SYS_EXP_ACTIONS              PACKAGE BODY                17048
SYS.DBMS_STREAMS_DATAPUMP                PACKAGE BODY                17032
SYS.KUPC$QUEUE_INT                       PACKAGE BODY                17032
SYS.DBMS_RULE_ADM                        PACKAGE BODY                17032
SYS.DBMS_LOCK                            PACKAGE BODY                17032
SYS.DBMS_RULEADM_INTERNAL                PACKAGE BODY                12952
SYS.DBMS_TRANSFORM_EXIMP_INTERNAL        PACKAGE BODY                12952
SYS.DBMS_REFRESH_EXP_SITES               PACKAGE BODY                12952
SYS.DBMS_REPCAT_RGT_EXP                  PACKAGE BODY                12936
SYS.UTL_RAW                              PACKAGE BODY                12936
SYS.DBMS_FLASHBACK                       PACKAGE BODY                12936
SYS.DBMS_TRANSFORM_EXIMP                 PACKAGE BODY                12936
SYS.DBMS_SCHED_JOB_EXPORT                PACKAGE BODY                12936
SYS.DBMS_REFRESH_EXP_LWM                 PACKAGE BODY                12936
SYS.DBMS_SCHED_EXPORT_CALLOUTS           PACKAGE BODY                 8856
SYS.DBMS_AQ_EXP_QUEUE_TABLES             PACKAGE BODY                 8856
SYS.DBMS_DEFER_IMPORT_INTERNAL           PACKAGE BODY                 8856
SYS.DBMS_INTERNAL_SAFE_SCN               PACKAGE BODY                 8856
SYS.DBMS_AQ_EXP_INDEX_TABLES             PACKAGE BODY                 8856
SYS.DBMS_AQ_EXP_HISTORY_TABLES           PACKAGE BODY                 8856
SYS.DBMS_AQ_EXP_SIGNATURE_TABLES         PACKAGE BODY                 8856
SYS.DBMS_AQ_EXP_DEQUEUELOG_TABLES        PACKAGE BODY                 8856
SYS.DBMS_AQ_EXP_SUBSCRIBER_TABLES        PACKAGE BODY                 8856
SYS.DBMS_AQ_EXP_CMT_TIME_TABLES          PACKAGE BODY                 8856
SYS.DBMS_AQ_EXP_TIMEMGR_TABLES           PACKAGE BODY                 8856
SYS.DBMS_RULE_EXP_RULES                  PACKAGE BODY                 8840
SYS.DBMS_RULE_EXP_UTLI                   PACKAGE BODY                 8840
SYS.DBMS_AQADM_INV                       PACKAGE BODY                 8840
SYS.DBMS_ZHELP_IR                        PACKAGE BODY                 8840
SYS.KUPC$QUEUE                           PACKAGE BODY                 8840
SYS.DBMS_AQ_EXP_ZECURITY                 PACKAGE BODY                 8840
SYS.KUPU$UTILITIES_INT                   PACKAGE BODY                 8840
SYS.KUPU$UTILITIES                       PACKAGE BODY                 8840
SYS.DBMS_REPCAT_EXP                      PACKAGE BODY                 8840
SYS.DBMS_CDC_EXPVDP                      PACKAGE BODY                 8840

total<<10MB
DataPump内部利用高级队列 Advanced Queue技术,所以也会用到流池Streams Pool,与之相关的Streams Pool组件包括:
POOL         NAME                            BYTES
------------ -------------------------- ----------
streams pool sob_kgqmrec                     19584
streams pool Sender info                     17616
streams pool recov_kgqbtctx                  11904
streams pool kwqbcqini:spilledovermsgs        3168
streams pool kgqbt_alloc_block                2096
streams pool recov_kgqmsub                    1608
streams pool kwqbsinfy:bqg                    1232
streams pool recov_kgqmctx                    1104
streams pool kwqbsinfy:mpr                    1088
streams pool kwqbsinfy:sta                     768
streams pool kgqmsub                           584
streams pool fixed allocation callback         448
streams pool kwqbsinfy:cco                     376
streams pool image handles                     288
streams pool kwqbsinfy:bms                     256
streams pool name_kgqmsub                      256
streams pool spilled:kwqbl                     256
streams pool deqtree_kgqmctx                   144
streams pool substree_kgqmctx                  144
streams pool kgqmdm_fl_1                       144
streams pool time manager index                144
streams pool msgtree_kgqmctx                   144
当Streams Pool分配过小同样可能引发Expdp/Impdp因ORA-04031 (“streams pool”, …)错误而意外终止,详见<EXPDP Fails With ORA-04031 (“streams pool”, …) [ID 457724.1]>
此外DataPump还可能从Large Pool中分配PX msg pool作为并行进程通信池,但是这种内存开销很小。
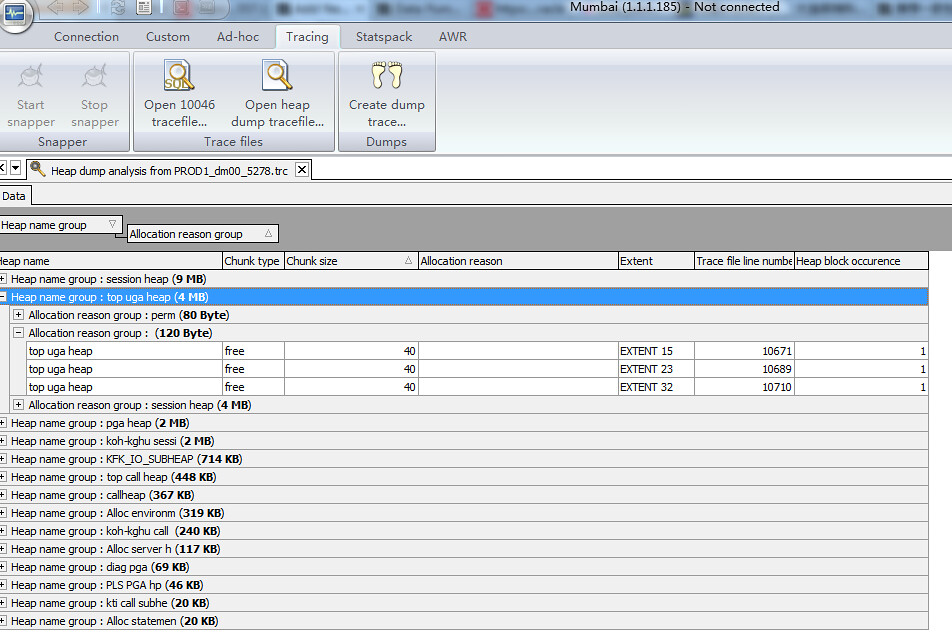
DataPump对PGA的消耗主要体现在koh-kghu sessi sub-heap上,已知的Bug 10404544(ORA – 4030 DURING EXPDP)、7681160(EXPDP FAILS WITH ORA-4030 WHEN SELECT FROM SYS.KU$_PROCACT_SCHEMA_VIEW)说明该子堆sub-heap(和另一个sub-heap kxs-heap-w)在10.2.0.4上使用expdp时可能引发内存泄露memory-leak。我们来具体看一下DataPump Manager DM00的PGA使用情况:
SQL> oradebug setospid 5278;
Oracle pid: 51, Unix process pid: 5278, image: oracle@rh2.oracle.com (DM00)

SQL> oradebug dump heapdump 536870917;
Statement processed.

SQL> oradebug tracefile_name;
/s01/orabase/diag/rdbms/prod/PROD1/trace/PROD1_dm00_5278.trc

SQL> select pga_alloc_mem / 1024 / 1024, pga_used_mem / 1024 / 1024, pname
  2    from v$process
  3   where addr = '00000000DCBC51F8'
  4  /

PGA_ALLOC_MEM/1024/1024 PGA_USED_MEM/1024/1024 PNAME
----------------------- ---------------------- -----
             8.06555557             7.25846481 DM00

[oracle@rh2 ~]$ egrep "HEAP DUMP heap name|Total heap size|Permanent space"
/s01/orabase/diag/rdbms/prod/PROD1/trace/PROD1_dm00_5278.trc

HEAP DUMP heap name="session heap"  desc=0x7fae4fc167f8
Total heap size    =  4517512
Permanent space    =   192664
HEAP DUMP heap name="koh-kghu sessi"  desc=0x7fae4f9db150
Total heap size    =   362416
Permanent space    =       80
HEAP DUMP heap name="koh-kghu sessi"  desc=0x7fae4fc47fb0
Total heap size    =   336104
Permanent space    =       80
HEAP DUMP heap name="koh-kghu sessi"  desc=0x7fae4f984660
Total heap size    =   156792
Permanent space    =       80
HEAP DUMP heap name="koh-kghu sessi"  desc=0x7fae4f988c88
Total heap size    =   154912
Permanent space    =       80
HEAP DUMP heap name="Alloc environm"  desc=0x7fae4fc3e090
Total heap size    =   129512
Permanent space    =      416
HEAP DUMP heap name="Alloc statemen"  desc=0x7fae4f8c91f8
Total heap size    =    10264
Permanent space    =      696
HEAP DUMP heap name="Alloc server h"  desc=0x7fae4f9f3650
Total heap size    =    10192
Permanent space    =     1056
HEAP DUMP heap name="Alloc server h"  desc=0x7fae4fc4fed0
Total heap size    =     9912
Permanent space    =     1488
HEAP DUMP heap name="Alloc server h"  desc=0x7fae4f8e4690
Total heap size    =     9080
Permanent space    =      560
HEAP DUMP heap name="Alloc server h"  desc=0x7fae4f8aeda0
Total heap size    =     8992
Permanent space    =      568
HEAP DUMP heap name="pga heap"  desc=0xb7c8ba0
Total heap size    =  2353064
Permanent space    =   654544
HEAP DUMP heap name="KFK_IO_SUBHEAP"  desc=0x7fae4fdfaa98
Total heap size    =   730640
Permanent space    =       80
HEAP DUMP heap name="koh-kghu call "  desc=0x7fae4fb650d0
Total heap size    =   246080
Permanent space    =       80
HEAP DUMP heap name="diag pga"  desc=0x7fae500347e0
Total heap size    =    70816
Permanent space    =    13472
HEAP DUMP heap name="Alloc environm"  desc=0x7fae4fdd15c8
Total heap size    =    68064
Permanent space    =     1336
HEAP DUMP heap name="Alloc server h"  desc=0x7fae4fb50ee0
Total heap size    =    12272
Permanent space    =     2096
HEAP DUMP heap name="Alloc server h"  desc=0x7fae4fb66c00
Total heap size    =    11784
Permanent space    =     1856
HEAP DUMP heap name="Alloc server h"  desc=0x7fae4fc14fc0
Total heap size    =     9816
Permanent space    =     1392
HEAP DUMP heap name="Alloc server h"  desc=0x7fae4fc10068
Total heap size    =     9664
Permanent space    =     1240
HEAP DUMP heap name="PLS PGA hp"  desc=0x7fae4fdeeab8
Total heap size    =    46784
Permanent space    =       80
HEAP DUMP heap name="top call heap"  desc=0xb7ce3c0
Total heap size    =   458584
Permanent space    =     1920
HEAP DUMP heap name="callheap"  desc=0xb7cd578
Total heap size    =   343104
Permanent space    =    65536
HEAP DUMP heap name="callheap"  desc=0xb7cd4c0
Total heap size    =    21616
Permanent space    =      968
HEAP DUMP heap name="kti call subhe"  desc=0x7fae4fdee018
Total heap size    =    20584
Permanent space    =       80
HEAP DUMP heap name="callheap"  desc=0x7fae4f6bd108
Total heap size    =     8952
Permanent space    =      200
HEAP DUMP heap name="callheap"  desc=0x7fae4f6bd030
Total heap size    =     2072
Permanent space    =     1672
HEAP DUMP heap name="top uga heap"  desc=0xb7ce5e0
Total heap size    =  4520496
Permanent space    =       80
HEAP DUMP heap name="session heap"  desc=0x7fae4fc167f8
Total heap size    =  4517512
Permanent space    =   192664
HEAP DUMP heap name="koh-kghu sessi"  desc=0x7fae4f9db150
Total heap size    =   362416
Permanent space    =       80
HEAP DUMP heap name="koh-kghu sessi"  desc=0x7fae4fc47fb0
Total heap size    =   336104
Permanent space    =       80
HEAP DUMP heap name="koh-kghu sessi"  desc=0x7fae4f984660
Total heap size    =   156792
Permanent space    =       80
HEAP DUMP heap name="koh-kghu sessi"  desc=0x7fae4f988c88
Total heap size    =   154912
Permanent space    =       80
HEAP DUMP heap name="Alloc environm"  desc=0x7fae4fc3e090
Total heap size    =   129512
Permanent space    =      416
HEAP DUMP heap name="Alloc statemen"  desc=0x7fae4f8c91f8
Total heap size    =    10264
Permanent space    =      696
HEAP DUMP heap name="Alloc server h"  desc=0x7fae4f9f3650
Total heap size    =    10192
Permanent space    =     1056
HEAP DUMP heap name="Alloc server h"  desc=0x7fae4fc4fed0
Total heap size    =     9912
Permanent space    =     1488
HEAP DUMP heap name="Alloc server h"  desc=0x7fae4f8e4690
Total heap size    =     9080
Permanent space    =      560
HEAP DUMP heap name="Alloc server h"  desc=0x7fae4f8aeda0
Total heap size    =     8992
Permanent space    =      568
一般遇到这类memory leak的问题,Oracle内部会使用一个名叫heap.awk的dump分析工具(类似于ass.awk)来找出问题子堆(problematic sub-heap),我们可以使用图形化的免费工具Membai来替代heap.awk。
总结:
DataPump工具Expdp/Impdp需要从PGA和SGA的Shared Pool、Streams Pool和Large Pool分配必要的内存。为了避免Expdp/Impdp出现ORA-04031/ORA-04030错误,我们有必要在自动管理模式下设置合理的pga_aggregate_target和sga_target(抑或者memory_target)内存初始化参数,如果使用手动的SGA管理的话,那么有必要保证shared_pool_size的设置适宜,对于Streams Pool和Large Pool一般设置为150MB大小。
前2天有客户报一套10.2.0.3的数据库个别服务进程PGA使用量暴涨,疑似内存泄露(memory leak);遂提供on-site service,赶到用户现场时问题进程已经消失,系统内存使用量恢复正常,客户之前除了保留了v$process动态性能视图的信息外未抓取其他有用的诊断信息。
查看保存的v$process视图信息可以看到进程991714的PGA内存使用量达到13个G:
select spid,program,PGA_USED_MEM,PGA_ALLOC_MEM from v$process;
SPID                     PROGRAM                                          PGA_USED_MEM PGA_ALLOC_MEM
------------------------ ------------------------------------------------ ------------ -------------
991714                         oracleBTS@oam_app_a             14427510986 14432001786

oracle@oam_app_a@/oracle/product/10.2.0/dbs $ ulimit -a
time(seconds)        unlimited
file(blocks)         unlimited
data(kbytes)         unlimited
stack(kbytes)        4194304
memory(kbytes)       unlimited
coredump(blocks)     unlimited
nofiles(descriptors) unlimited

SQL> select x.ksppinm name,y.ksppstvl value
  2  from sys.x$ksppi x, sys.x$ksppcv y
  3  where x.inst_id=USERENV('Instance')
  4  and y.inst_id = USERENV('Instance')
  5  and x.indx = y.indx
  6  and x.ksppinm like '%pga%';

pga_aggregate_target
200715200

NAME
--------------------------------------------------------------------------------
VALUE
--------------------------------------------------------------------------------
_pga_max_size
209715200

SQL> select x.ksppinm name,y.ksppstvl value
  2  from sys.x$ksppi x, sys.x$ksppcv y
  3  where x.inst_id=USERENV('Instance')
  4  and y.inst_id = USERENV('Instance')
  5  and x.indx = y.indx
  6  and x.ksppinm like '%hash_join%';

NAME
--------------------------------------------------------------------------------
VALUE
--------------------------------------------------------------------------------
_hash_join_enabled
TRUE

SQL> show parameter work

NAME                                 TYPE        VALUE
------------------------------------ ----------- ------------------------------
fileio_network_adapters              string
workarea_size_policy                 string      AUTO
可以看到该系统使用自动PGA管理且pga_aggregate_target参数值为较小的191M,查询隐藏参数_pga_max_size可发现该参数值也为191M。
从告警日志alert.log中找不到任何信息,单个服务进程PGA使用量达到13G居然没有报ORA-04030错误!
到实例的user_dump目录下ls -ltr了一把有意外收获,找到了该991714进程最近的trace文件:
Dump file /oracle/product/10.2.0/admin/BTS/udump/bts_ora_991714.trc
Oracle Database 10g Enterprise Edition Release 10.2.0.3.0 - 64bit Production
With the Partitioning, OLAP and Data Mining options
ORACLE_HOME = /oracle/product/10.2.0
System name:    AIX
Node name:      oam_app_a
Release:        3
Version:        5
Machine:        0000E5DBD600
Instance name: BTS
Redo thread mounted by this instance: 1
Oracle process number: 46
Unix process pid: 991714, image: oracleBTS@oam_app_a

*** 2011-04-19 18:27:07.766
*** SERVICE NAME:(SYS$USERS) 2011-04-19 18:27:07.733
*** SESSION ID:(248.45987) 2011-04-19 18:27:07.733
WARNING: out of private memory [1]
以上trace文件中唯一有用的信息就是”WARNING: out of private memory [1]”了,但在metalink上搜索”out of private memory”找不到任何有用的信息;因为未发生ORA-04030错误,而用户也没有手动去收集过PGA Heap的堆使用情况,所以未产生任何对该进程PGA内存使用细节描述的转储信息文件,难以从dump信息中获取线索继续探索,线索断裂。
通过查询PGA状态历史记录视图可以发现在之前的2个快照时间窗口内,inused PGA总量为13G,之后PGA内存使用量又恢复正常:
select * from dba_hist_pgastat where name='total PGA inuse' order by value asc
 SNAP_ID       DBID INSTANCE_NUMBER NAME                                                                  VALUE
---------- ---------- --------------- ---------------------------------------------------------------- ----------
     16048 3731271451               1 total PGA inuse                                                  1.4883E+10
     16047 3731271451               1 total PGA inuse                                                  1.4888E+10
查询在以上时间窗口中991714的活动会话记录,可以发现该进程一直处于”cursor: pin S wait on X”中;Oracle 10.2.0.2以后利用mutex来替代latch保护SQL游标,当硬解析发生时会出现”cursor: pin s wait on X”等待。这里可以看到需要硬解析的SQL的ID为”bp7y9fvtqra1h”,而且此处SQL_CHILD_NUMBER为-1,说明Oracle共享池中之前没有缓存该SQL游标,该问题进程是首次为该SQL语句执行硬解析。
     	SNAP_ID	DBID	INSTANCE_NUMBER	SAMPLE_ID	SAMPLE_TIME	SESSION_ID	SESSION_SERIAL#	USER_ID	SQL_ID	SQL_CHILD_NUMBER	SQL_PLAN_HASH_VALUE	FORCE_MATCHING_SIGNATURE	SQL_OPCODE	PLSQL_ENTRY_OBJECT_ID	PLSQL_ENTRY_SUBPROGRAM_ID	PLSQL_OBJECT_ID	PLSQL_SUBPROGRAM_ID	SERVICE_HASH	SESSION_TYPE	SESSION_STATE	QC_SESSION_ID	QC_INSTANCE_ID	BLOCKING_SESSION	BLOCKING_SESSION_STATUS	BLOCKING_SESSION_SERIAL#	EVENT	EVENT_ID	SEQ#	P1TEXT	P1	P2TEXT	P2	P3TEXT	P3	WAIT_CLASS	WAIT_CLASS_ID	WAIT_TIME	TIME_WAITED	XID	CURRENT_OBJ#	CURRENT_FILE#	CURRENT_BLOCK#	PROGRAM	MODULE	ACTION	CLIENT_ID
1	16047	3731271451	1	57716200	19-4月 -11 04.00.35.625 下午	248	45987	25	bp7y9fvtqra1h	-1	0	0	0					3427055676	FOREGROUND	WAITING				UNKNOWN		cursor: pin S wait on X	1729366244	1140	idn	4083918896	value	1.14676E+12	where|sleeps	21474836525	Concurrency	3875070507	0	9772		-1	0	0
2	16047	3731271451	1	57716210	19-4月 -11 04.00.45.629 下午	248	45987	25	bp7y9fvtqra1h	-1	0	0	0					3427055676	FOREGROUND	WAITING				UNKNOWN		cursor: pin S wait on X	1729366244	2137	idn	4083918896	value	1.14676E+12	where|sleeps	21474837522	Concurrency	3875070507	0	9773		-1	0	0
3	16047	3731271451	1	57716220	19-4月 -11 04.00.55.633 下午	248	45987	25	bp7y9fvtqra1h	-1	0	0	0					3427055676	FOREGROUND	WAITING				UNKNOWN		cursor: pin S wait on X	1729366244	3134	idn	4083918896	value	1.14676E+12	where|sleeps	21474838519	Concurrency	3875070507	0	9775		-1	0	0
4	16047	3731271451	1	57716230	19-4月 -11 04.01.05.637 下午	248	45987	25	bp7y9fvtqra1h	-1	0	0	0					3427055676	FOREGROUND	WAITING				UNKNOWN		cursor: pin S wait on X	1729366244	4126	idn	4083918896	value	1.14676E+12	where|sleeps	21474839511	Concurrency	3875070507	0	9772		-1	0	0
但无论是从SQL历史记录视图(Workload Repository)还是v$SQL中都无法找到该条语句,可以判断该问题进程最后也没能成功完成对该’bp7y9fvtqra1h’语句的解析!因为没有该SQL的记录,所以也无法了解该SQL的执行计划和workarea工作区的使用状况,线索再次断裂!
SQL> select * from dba_hist_sqltext where sql_id='bp7y9fvtqra1h';

no rows selected

SQL> select * From v$sql where sql_id='bp7y9fvtqra1h';

no rows selected
通过查询进程内存使用总结历史视图dba_hist_process_mem_summary可以发现占用主要内存的分类是Other,猜测这些Other内存是用来解析游标使用的临时内存(call heap).
SQL> select snap_id,category,num_processes,non_zero_allocs,used_total,allocated_total,allocated_max from dba_hist_process_mem_summary where snap_id in (16047,16048,16049) order by allocated_total desc ,snap_id ;

   SNAP_ID CATEGORY        NUM_PROCESSES NON_ZERO_ALLOCS USED_TOTAL ALLOCATED_TOTAL ALLOCATED_MAX
---------- --------------- ------------- --------------- ---------- --------------- -------------
     16047 Other                      95              95                 1.5062E+10    1.4665E+10
     16048 Other                      96              96                 1.5053E+10    1.4664E+10
     16049 Other                      94              94                  386117660      53794202
     16047 Freeable                   36              36          0        36372480       3670016
     16048 Freeable                   33              33          0        32112640       3670016
     16047 SQL                        78              31   27346656        29785568      28016616
     16048 SQL                        79              34   26812992        29240400      27885544
     16049 Freeable                   27              27          0        26738688       3670016
     16049 SQL                        77              31     591528         1242168        125816
     16048 PL/SQL                     96              96     272224          601040         68944
     16049 PL/SQL                     94              94     218104          536592         68944
     16047 PL/SQL                     95              95     212816          506536         68800
因为证据断裂,无法根据现有的信息为该服务进程过量使用PGA内存来定位Bug。到MOS上搜索找不到类似的Bug,但即使有也很难定论,因为没有heapdump的话即便提交SR,Oracle GCS(Global Customer Service)也不太愿定位到Bug。
那么如果出现以上类似的PGA内存泄露的问题,我们因当如何第一时间收集有用的信息,以供后续诊断呢?我在这里提供一些可选的方案:
虽然以上我们介绍了一些针对PGA内存泄露问题发生时的诊断方法,但可能你还是不了解具体要如何实践,接下来我们通过实践来体会一下,首先我们特意构建一个PGA内存泄露的假象(测试说明,不要用于生产环境!!):
[oracle@rh2 ~]$ wc -l very_large.sql
18526 very_large.sql
/* 这里very_large.sql是我们"精心"构造的一条万分复杂的SQL语句,解析该SQL语句需要消耗大量的PGA内存 !!* /
SQL> @very_large
/* 执行very_large SQL语句开始模拟内存泄露,将持续较长时间 */
SQL> @MEMORY_USAGE_SCRIPT.SQL
Oracle Memory Usage Report: PGA And UGA Memory Usage Per Session
Host........: rh2.oracle.com
Name........: PROD1
Version.....: 11.2.0.2.0
Startup Time: 2011-04-20 19:41:32
Current Time: 2011.04.21-19:57:16
Worst possible value of concurrent PGA + UGA memory usage per session:
SID AND SERIAL# USERNAME OR PROGRAM SUM(VALUE) SESSION START TIME
------------------- ------------------------------------------------ ---------- -------------------
29,465 SYS 180444688 2011-04-21 19:52:16
152,987 SYS 67781616 2011-04-21 18:40:59
146,1 oracle@rh2.oracle.com (ARC3) 37598184 2011-04-20 19:41:43
19,5 oracle@rh2.oracle.com (ARC2) 36484072 2011-04-20 19:41:43
17,7 oracle@rh2.oracle.com (ARC0) 33141736 2011-04-20 19:41:42
145,1 oracle@rh2.oracle.com (ARC1) 19837928 2011-04-20 19:41:43
125,7 oracle@rh2.oracle.com (CJQ0) 15826432 2011-04-20 19:41:50
135,1 oracle@rh2.oracle.com (LGWR) 13480936 2011-04-20 19:41:33
131,1 oracle@rh2.oracle.com (LMS0) 11973608 2011-04-20 19:41:33
7,1 oracle@rh2.oracle.com (LMS1) 11973608 2011-04-20 19:41:33
6,1 oracle@rh2.oracle.com (LMD0) 11842536 2011-04-20 19:41:33
5,1 oracle@rh2.oracle.com (DIA0) 10580296 2011-04-20 19:41:33
25,57 SYS 9854112 2011-04-21 19:56:59
10,1 oracle@rh2.oracle.com (DBW0) 9105992 2011-04-20 19:41:33
136,1 oracle@rh2.oracle.com (SMON) 8777056 2011-04-20 19:41:33
140,1 oracle@rh2.oracle.com (MARK) 8565736 2011-04-20 19:41:33
130,1 oracle@rh2.oracle.com (LMON) 8238120 2011-04-20 19:41:33
138,1 oracle@rh2.oracle.com (MMON) 7215184 2011-04-20 19:41:33
31,1 oracle@rh2.oracle.com (SMCO) 7123896 2011-04-20 19:43:52
3,1 oracle@rh2.oracle.com (DIAG) 6730728 2011-04-20 19:41:33
16,1 oracle@rh2.oracle.com (RSMN) 5420008 2011-04-20 19:41:35
150,5 oracle@rh2.oracle.com (Q000) 5001608 2011-04-20 19:41:46
23,1 oracle@rh2.oracle.com (Q001) 3445984 2011-04-20 19:41:46
22,1 oracle@rh2.oracle.com (QMNC) 3314960 2011-04-20 19:41:45
12,1 oracle@rh2.oracle.com (RECO) 3249448 2011-04-20 19:41:33
11,1 oracle@rh2.oracle.com (CKPT) 3086120 2011-04-20 19:41:33
128,1 oracle@rh2.oracle.com (DBRM) 2667304 2011-04-20 19:41:33
14,1 oracle@rh2.oracle.com (MMNL) 2143208 2011-04-20 19:41:33
127,1 oracle@rh2.oracle.com (GEN0) 2012136 2011-04-20 19:41:33
158,183 SYS 1758344 2011-04-21 07:44:57
143,23 SYS 1692808 2011-04-21 07:45:01
142,1 oracle@rh2.oracle.com (LCK0) 1299288 2011-04-20 19:41:34
149,1 oracle@rh2.oracle.com (RCBG) 1160120 2011-04-20 19:41:45
33,59 oracle@rh2.oracle.com (W000) 963512 2011-04-21 19:55:14
4,1 oracle@rh2.oracle.com (PING) 898024 2011-04-20 19:41:33
126,1 oracle@rh2.oracle.com (PSP0) 832488 2011-04-20 19:41:32
13,1 oracle@rh2.oracle.com (ASMB) 832488 2011-04-20 19:41:33
134,1 oracle@rh2.oracle.com (MMAN) 832488 2011-04-20 19:41:33
144,1 oracle@rh2.oracle.com (O000) 832488 2011-04-20 19:41:36
129,1 oracle@rh2.oracle.com (ACMS) 832488 2011-04-20 19:41:33
133,1 oracle@rh2.oracle.com (RMS0) 832488 2011-04-20 19:41:33
1,1 oracle@rh2.oracle.com (PMON) 832488 2011-04-20 19:41:32
9,1 oracle@rh2.oracle.com (LMHB) 832488 2011-04-20 19:41:33
21,1 oracle@rh2.oracle.com (GTX0) 832488 2011-04-20 19:41:45
18,3 oracle@rh2.oracle.com (O001) 832488 2011-04-20 19:41:37
137,1 oracle@rh2.oracle.com (RBAL) 832488 2011-04-20 19:41:33
2,1 oracle@rh2.oracle.com (VKTM) 832488 2011-04-20 19:41:33
Worst possible total and average values of concurrent PGA + UGA memory usage:
564679192 bytes (total) and ~6007225 bytes (average), for ~47 sessions.
Approximate value of current PGA + UGA memory usage per session:
SID AND SERIAL# USERNAME OR PROGRAM SUM(VALUE) SESSION START TIME
------------------- ------------------------------------------------ ---------- -------------------
29,465 SYS 178083824 2011-04-21 19:52:16
146,1 oracle@rh2.oracle.com (ARC3) 36484072 2011-04-20 19:41:43
19,5 oracle@rh2.oracle.com (ARC2) 35369960 2011-04-20 19:41:43
17,7 oracle@rh2.oracle.com (ARC0) 33141736 2011-04-20 19:41:42
145,1 oracle@rh2.oracle.com (ARC1) 19837928 2011-04-20 19:41:43
135,1 oracle@rh2.oracle.com (LGWR) 13480936 2011-04-20 19:41:33
7,1 oracle@rh2.oracle.com (LMS1) 11973608 2011-04-20 19:41:33
131,1 oracle@rh2.oracle.com (LMS0) 11973608 2011-04-20 19:41:33
6,1 oracle@rh2.oracle.com (LMD0) 11842536 2011-04-20 19:41:33
5,1 oracle@rh2.oracle.com (DIA0) 10580296 2011-04-20 19:41:33
10,1 oracle@rh2.oracle.com (DBW0) 8712776 2011-04-20 19:41:33
140,1 oracle@rh2.oracle.com (MARK) 8565736 2011-04-20 19:41:33
130,1 oracle@rh2.oracle.com (LMON) 8238120 2011-04-20 19:41:33
3,1 oracle@rh2.oracle.com (DIAG) 6730728 2011-04-20 19:41:33
152,987 SYS 6224040 2011-04-21 18:40:59
16,1 oracle@rh2.oracle.com (RSMN) 5420008 2011-04-20 19:41:35
125,7 oracle@rh2.oracle.com (CJQ0) 4854824 2011-04-20 19:41:50
25,57 SYS 4738504 2011-04-21 19:56:59
138,1 oracle@rh2.oracle.com (MMON) 4165448 2011-04-20 19:41:33
136,1 oracle@rh2.oracle.com (SMON) 3863504 2011-04-20 19:41:33
150,5 oracle@rh2.oracle.com (Q000) 3108848 2011-04-20 19:41:46
11,1 oracle@rh2.oracle.com (CKPT) 2561832 2011-04-20 19:41:33
12,1 oracle@rh2.oracle.com (RECO) 2538120 2011-04-20 19:41:33
31,1 oracle@rh2.oracle.com (SMCO) 2536376 2011-04-20 19:43:52
128,1 oracle@rh2.oracle.com (DBRM) 2339768 2011-04-20 19:41:33
23,1 oracle@rh2.oracle.com (Q001) 2339672 2011-04-20 19:41:46
22,1 oracle@rh2.oracle.com (QMNC) 2242336 2011-04-20 19:41:45
127,1 oracle@rh2.oracle.com (GEN0) 2012136 2011-04-20 19:41:33
14,1 oracle@rh2.oracle.com (MMNL) 1946600 2011-04-20 19:41:33
158,183 SYS 1692856 2011-04-21 07:44:57
143,23 SYS 1561784 2011-04-21 07:45:01
142,1 oracle@rh2.oracle.com (LCK0) 1299288 2011-04-20 19:41:34
149,1 oracle@rh2.oracle.com (RCBG) 1160120 2011-04-20 19:41:45
33,59 oracle@rh2.oracle.com (W000) 963512 2011-04-21 19:55:14
4,1 oracle@rh2.oracle.com (PING) 898024 2011-04-20 19:41:33
13,1 oracle@rh2.oracle.com (ASMB) 832488 2011-04-20 19:41:33
134,1 oracle@rh2.oracle.com (MMAN) 832488 2011-04-20 19:41:33
129,1 oracle@rh2.oracle.com (ACMS) 832488 2011-04-20 19:41:33
1,1 oracle@rh2.oracle.com (PMON) 832488 2011-04-20 19:41:32
9,1 oracle@rh2.oracle.com (LMHB) 832488 2011-04-20 19:41:33
21,1 oracle@rh2.oracle.com (GTX0) 832488 2011-04-20 19:41:45
18,3 oracle@rh2.oracle.com (O001) 832488 2011-04-20 19:41:37
137,1 oracle@rh2.oracle.com (RBAL) 832488 2011-04-20 19:41:33
126,1 oracle@rh2.oracle.com (PSP0) 832488 2011-04-20 19:41:32
133,1 oracle@rh2.oracle.com (RMS0) 832488 2011-04-20 19:41:33
2,1 oracle@rh2.oracle.com (VKTM) 832488 2011-04-20 19:41:33
144,1 oracle@rh2.oracle.com (O000) 832488 2011-04-20 19:41:36
Current total and average values of concurrent PGA + UGA memory usage:
463473320 bytes (total) and ~4930567 bytes (average), for ~47 sessions.
Maximum value of PGA memory usage per session:
SID AND SERIAL# USERNAME OR PROGRAM VALUE SESSION START TIME
------------------- ------------------------------------------------ ---------- -------------------
29,465 SYS 177212856 2011-04-21 19:52:16
152,987 SYS 57208040 2011-04-21 18:40:59
146,1 oracle@rh2.oracle.com (ARC3) 37416168 2011-04-20 19:41:43
19,5 oracle@rh2.oracle.com (ARC2) 36302056 2011-04-20 19:41:43
17,7 oracle@rh2.oracle.com (ARC0) 32959720 2011-04-20 19:41:42
145,1 oracle@rh2.oracle.com (ARC1) 19655912 2011-04-20 19:41:43
135,1 oracle@rh2.oracle.com (LGWR) 13298920 2011-04-20 19:41:33
125,7 oracle@rh2.oracle.com (CJQ0) 13045176 2011-04-20 19:41:50
131,1 oracle@rh2.oracle.com (LMS0) 11791592 2011-04-20 19:41:33
7,1 oracle@rh2.oracle.com (LMS1) 11791592 2011-04-20 19:41:33
6,1 oracle@rh2.oracle.com (LMD0) 11660520 2011-04-20 19:41:33
5,1 oracle@rh2.oracle.com (DIA0) 10398280 2011-04-20 19:41:33
10,1 oracle@rh2.oracle.com (DBW0) 8923976 2011-04-20 19:41:33
140,1 oracle@rh2.oracle.com (MARK) 8383720 2011-04-20 19:41:33
130,1 oracle@rh2.oracle.com (LMON) 8056104 2011-04-20 19:41:33
31,1 oracle@rh2.oracle.com (SMCO) 6876392 2011-04-20 19:43:52
3,1 oracle@rh2.oracle.com (DIAG) 6548712 2011-04-20 19:41:33
25,57 SYS 6163896 2011-04-21 19:56:59
136,1 oracle@rh2.oracle.com (SMON) 5893352 2011-04-20 19:41:33
138,1 oracle@rh2.oracle.com (MMON) 5294872 2011-04-20 19:41:33
16,1 oracle@rh2.oracle.com (RSMN) 5237992 2011-04-20 19:41:35
150,5 oracle@rh2.oracle.com (Q000) 3910216 2011-04-20 19:41:46
11,1 oracle@rh2.oracle.com (CKPT) 2904104 2011-04-20 19:41:33
23,1 oracle@rh2.oracle.com (Q001) 2551016 2011-04-20 19:41:46
22,1 oracle@rh2.oracle.com (QMNC) 2485480 2011-04-20 19:41:45
12,1 oracle@rh2.oracle.com (RECO) 2485480 2011-04-20 19:41:33
128,1 oracle@rh2.oracle.com (DBRM) 2223336 2011-04-20 19:41:33
14,1 oracle@rh2.oracle.com (MMNL) 1961192 2011-04-20 19:41:33
127,1 oracle@rh2.oracle.com (GEN0) 1830120 2011-04-20 19:41:33
158,183 SYS 1510840 2011-04-21 07:44:57
143,23 SYS 1445304 2011-04-21 07:45:01
142,1 oracle@rh2.oracle.com (LCK0) 1117272 2011-04-20 19:41:34
149,1 oracle@rh2.oracle.com (RCBG) 912616 2011-04-20 19:41:45
33,59 oracle@rh2.oracle.com (W000) 716008 2011-04-21 19:55:14
4,1 oracle@rh2.oracle.com (PING) 716008 2011-04-20 19:41:33
144,1 oracle@rh2.oracle.com (O000) 650472 2011-04-20 19:41:36
137,1 oracle@rh2.oracle.com (RBAL) 650472 2011-04-20 19:41:33
134,1 oracle@rh2.oracle.com (MMAN) 650472 2011-04-20 19:41:33
133,1 oracle@rh2.oracle.com (RMS0) 650472 2011-04-20 19:41:33
129,1 oracle@rh2.oracle.com (ACMS) 650472 2011-04-20 19:41:33
126,1 oracle@rh2.oracle.com (PSP0) 650472 2011-04-20 19:41:32
21,1 oracle@rh2.oracle.com (GTX0) 650472 2011-04-20 19:41:45
18,3 oracle@rh2.oracle.com (O001) 650472 2011-04-20 19:41:37
13,1 oracle@rh2.oracle.com (ASMB) 650472 2011-04-20 19:41:33
9,1 oracle@rh2.oracle.com (LMHB) 650472 2011-04-20 19:41:33
2,1 oracle@rh2.oracle.com (VKTM) 650472 2011-04-20 19:41:33
1,1 oracle@rh2.oracle.com (PMON) 650472 2011-04-20 19:41:32
Worst possible total and average values of concurrent PGA memory usage:
528694504 bytes (total) and ~11248819 bytes (average), for ~47 sessions.
Maximum value of UGA memory usage per session:
SID AND SERIAL# USERNAME OR PROGRAM VALUE SESSION START TIME
------------------- ------------------------------------------------ ---------- -------------------
152,987 SYS 10573576 2011-04-21 18:40:59
25,57 SYS 3690216 2011-04-21 19:56:59
29,465 SYS 3231832 2011-04-21 19:52:16
136,1 oracle@rh2.oracle.com (SMON) 2883704 2011-04-20 19:41:33
125,7 oracle@rh2.oracle.com (CJQ0) 2781256 2011-04-20 19:41:50
138,1 oracle@rh2.oracle.com (MMON) 1920312 2011-04-20 19:41:33
150,5 oracle@rh2.oracle.com (Q000) 1091392 2011-04-20 19:41:46
23,1 oracle@rh2.oracle.com (Q001) 894968 2011-04-20 19:41:46
22,1 oracle@rh2.oracle.com (QMNC) 829480 2011-04-20 19:41:45
12,1 oracle@rh2.oracle.com (RECO) 763968 2011-04-20 19:41:33
128,1 oracle@rh2.oracle.com (DBRM) 443968 2011-04-20 19:41:33
158,183 SYS 247504 2011-04-21 07:44:57
149,1 oracle@rh2.oracle.com (RCBG) 247504 2011-04-20 19:41:45
143,23 SYS 247504 2011-04-21 07:45:01
33,59 oracle@rh2.oracle.com (W000) 247504 2011-04-21 19:55:14
31,1 oracle@rh2.oracle.com (SMCO) 247504 2011-04-20 19:43:52
146,1 oracle@rh2.oracle.com (ARC3) 182016 2011-04-20 19:41:43
145,1 oracle@rh2.oracle.com (ARC1) 182016 2011-04-20 19:41:43
144,1 oracle@rh2.oracle.com (O000) 182016 2011-04-20 19:41:36
142,1 oracle@rh2.oracle.com (LCK0) 182016 2011-04-20 19:41:34
140,1 oracle@rh2.oracle.com (MARK) 182016 2011-04-20 19:41:33
137,1 oracle@rh2.oracle.com (RBAL) 182016 2011-04-20 19:41:33
135,1 oracle@rh2.oracle.com (LGWR) 182016 2011-04-20 19:41:33
134,1 oracle@rh2.oracle.com (MMAN) 182016 2011-04-20 19:41:33
133,1 oracle@rh2.oracle.com (RMS0) 182016 2011-04-20 19:41:33
131,1 oracle@rh2.oracle.com (LMS0) 182016 2011-04-20 19:41:33
130,1 oracle@rh2.oracle.com (LMON) 182016 2011-04-20 19:41:33
129,1 oracle@rh2.oracle.com (ACMS) 182016 2011-04-20 19:41:33
127,1 oracle@rh2.oracle.com (GEN0) 182016 2011-04-20 19:41:33
126,1 oracle@rh2.oracle.com (PSP0) 182016 2011-04-20 19:41:32
21,1 oracle@rh2.oracle.com (GTX0) 182016 2011-04-20 19:41:45
19,5 oracle@rh2.oracle.com (ARC2) 182016 2011-04-20 19:41:43
18,3 oracle@rh2.oracle.com (O001) 182016 2011-04-20 19:41:37
17,7 oracle@rh2.oracle.com (ARC0) 182016 2011-04-20 19:41:42
16,1 oracle@rh2.oracle.com (RSMN) 182016 2011-04-20 19:41:35
14,1 oracle@rh2.oracle.com (MMNL) 182016 2011-04-20 19:41:33
13,1 oracle@rh2.oracle.com (ASMB) 182016 2011-04-20 19:41:33
11,1 oracle@rh2.oracle.com (CKPT) 182016 2011-04-20 19:41:33
10,1 oracle@rh2.oracle.com (DBW0) 182016 2011-04-20 19:41:33
9,1 oracle@rh2.oracle.com (LMHB) 182016 2011-04-20 19:41:33
7,1 oracle@rh2.oracle.com (LMS1) 182016 2011-04-20 19:41:33
6,1 oracle@rh2.oracle.com (LMD0) 182016 2011-04-20 19:41:33
5,1 oracle@rh2.oracle.com (DIA0) 182016 2011-04-20 19:41:33
4,1 oracle@rh2.oracle.com (PING) 182016 2011-04-20 19:41:33
3,1 oracle@rh2.oracle.com (DIAG) 182016 2011-04-20 19:41:33
2,1 oracle@rh2.oracle.com (VKTM) 182016 2011-04-20 19:41:33
1,1 oracle@rh2.oracle.com (PMON) 182016 2011-04-20 19:41:32
Worst possible total and average values of concurrent UGA memory usage:
35984688 bytes (total) and ~765631 bytes (average), for ~47 sessions.
Current value of PGA memory usage per session:
SID AND SERIAL# USERNAME OR PROGRAM VALUE SESSION START TIME
------------------- ------------------------------------------------ ---------- -------------------
29,465 SYS 177802680 2011-04-21 19:52:16
146,1 oracle@rh2.oracle.com (ARC3) 36302056 2011-04-20 19:41:43
19,5 oracle@rh2.oracle.com (ARC2) 35187944 2011-04-20 19:41:43
17,7 oracle@rh2.oracle.com (ARC0) 32959720 2011-04-20 19:41:42
145,1 oracle@rh2.oracle.com (ARC1) 19655912 2011-04-20 19:41:43
135,1 oracle@rh2.oracle.com (LGWR) 13298920 2011-04-20 19:41:33
131,1 oracle@rh2.oracle.com (LMS0) 11791592 2011-04-20 19:41:33
7,1 oracle@rh2.oracle.com (LMS1) 11791592 2011-04-20 19:41:33
6,1 oracle@rh2.oracle.com (LMD0) 11660520 2011-04-20 19:41:33
5,1 oracle@rh2.oracle.com (DIA0) 10398280 2011-04-20 19:41:33
10,1 oracle@rh2.oracle.com (DBW0) 8530760 2011-04-20 19:41:33
140,1 oracle@rh2.oracle.com (MARK) 8383720 2011-04-20 19:41:33
130,1 oracle@rh2.oracle.com (LMON) 8056104 2011-04-20 19:41:33
3,1 oracle@rh2.oracle.com (DIAG) 6548712 2011-04-20 19:41:33
16,1 oracle@rh2.oracle.com (RSMN) 5237992 2011-04-20 19:41:35
152,987 SYS 4582632 2011-04-21 18:40:59
125,7 oracle@rh2.oracle.com (CJQ0) 3935672 2011-04-20 19:41:50
25,57 SYS 3787544 2011-04-21 19:56:59
136,1 oracle@rh2.oracle.com (SMON) 3140840 2011-04-20 19:41:33
138,1 oracle@rh2.oracle.com (MMON) 3066648 2011-04-20 19:41:33
150,5 oracle@rh2.oracle.com (Q000) 2468424 2011-04-20 19:41:46
11,1 oracle@rh2.oracle.com (CKPT) 2379816 2011-04-20 19:41:33
31,1 oracle@rh2.oracle.com (SMCO) 2288872 2011-04-20 19:43:52
12,1 oracle@rh2.oracle.com (RECO) 2223336 2011-04-20 19:41:33
128,1 oracle@rh2.oracle.com (DBRM) 2092264 2011-04-20 19:41:33
23,1 oracle@rh2.oracle.com (Q001) 1961192 2011-04-20 19:41:46
22,1 oracle@rh2.oracle.com (QMNC) 1961192 2011-04-20 19:41:45
127,1 oracle@rh2.oracle.com (GEN0) 1830120 2011-04-20 19:41:33
14,1 oracle@rh2.oracle.com (MMNL) 1764584 2011-04-20 19:41:33
158,183 SYS 1510840 2011-04-21 07:44:57
143,23 SYS 1379768 2011-04-21 07:45:01
142,1 oracle@rh2.oracle.com (LCK0) 1117272 2011-04-20 19:41:34
149,1 oracle@rh2.oracle.com (RCBG) 912616 2011-04-20 19:41:45
33,59 oracle@rh2.oracle.com (W000) 716008 2011-04-21 19:55:14
4,1 oracle@rh2.oracle.com (PING) 716008 2011-04-20 19:41:33
144,1 oracle@rh2.oracle.com (O000) 650472 2011-04-20 19:41:36
137,1 oracle@rh2.oracle.com (RBAL) 650472 2011-04-20 19:41:33
134,1 oracle@rh2.oracle.com (MMAN) 650472 2011-04-20 19:41:33
133,1 oracle@rh2.oracle.com (RMS0) 650472 2011-04-20 19:41:33
129,1 oracle@rh2.oracle.com (ACMS) 650472 2011-04-20 19:41:33
126,1 oracle@rh2.oracle.com (PSP0) 650472 2011-04-20 19:41:32
21,1 oracle@rh2.oracle.com (GTX0) 650472 2011-04-20 19:41:45
18,3 oracle@rh2.oracle.com (O001) 650472 2011-04-20 19:41:37
13,1 oracle@rh2.oracle.com (ASMB) 650472 2011-04-20 19:41:33
9,1 oracle@rh2.oracle.com (LMHB) 650472 2011-04-20 19:41:33
2,1 oracle@rh2.oracle.com (VKTM) 650472 2011-04-20 19:41:33
1,1 oracle@rh2.oracle.com (PMON) 650472 2011-04-20 19:41:32
Current total and average values of concurrent PGA memory usage:
449247816 bytes (total) and ~9558464 bytes (average), for ~47 sessions.
Current value of UGA memory usage per session:
SID AND SERIAL# USERNAME OR PROGRAM VALUE SESSION START TIME
------------------- ------------------------------------------------ ---------- -------------------
152,987 SYS 1641408 2011-04-21 18:40:59
138,1 oracle@rh2.oracle.com (MMON) 1098800 2011-04-20 19:41:33
25,57 SYS 950960 2011-04-21 19:56:59
125,7 oracle@rh2.oracle.com (CJQ0) 919152 2011-04-20 19:41:50
136,1 oracle@rh2.oracle.com (SMON) 722664 2011-04-20 19:41:33
150,5 oracle@rh2.oracle.com (Q000) 640424 2011-04-20 19:41:46
23,1 oracle@rh2.oracle.com (Q001) 378480 2011-04-20 19:41:46
12,1 oracle@rh2.oracle.com (RECO) 314784 2011-04-20 19:41:33
29,465 SYS 281144 2011-04-21 19:52:16
22,1 oracle@rh2.oracle.com (QMNC) 281144 2011-04-20 19:41:45
149,1 oracle@rh2.oracle.com (RCBG) 247504 2011-04-20 19:41:45
128,1 oracle@rh2.oracle.com (DBRM) 247504 2011-04-20 19:41:33
33,59 oracle@rh2.oracle.com (W000) 247504 2011-04-21 19:55:14
31,1 oracle@rh2.oracle.com (SMCO) 247504 2011-04-20 19:43:52
158,183 SYS 182016 2011-04-21 07:44:57
146,1 oracle@rh2.oracle.com (ARC3) 182016 2011-04-20 19:41:43
145,1 oracle@rh2.oracle.com (ARC1) 182016 2011-04-20 19:41:43
144,1 oracle@rh2.oracle.com (O000) 182016 2011-04-20 19:41:36
143,23 SYS 182016 2011-04-21 07:45:01
142,1 oracle@rh2.oracle.com (LCK0) 182016 2011-04-20 19:41:34
140,1 oracle@rh2.oracle.com (MARK) 182016 2011-04-20 19:41:33
137,1 oracle@rh2.oracle.com (RBAL) 182016 2011-04-20 19:41:33
135,1 oracle@rh2.oracle.com (LGWR) 182016 2011-04-20 19:41:33
134,1 oracle@rh2.oracle.com (MMAN) 182016 2011-04-20 19:41:33
133,1 oracle@rh2.oracle.com (RMS0) 182016 2011-04-20 19:41:33
131,1 oracle@rh2.oracle.com (LMS0) 182016 2011-04-20 19:41:33
130,1 oracle@rh2.oracle.com (LMON) 182016 2011-04-20 19:41:33
129,1 oracle@rh2.oracle.com (ACMS) 182016 2011-04-20 19:41:33
127,1 oracle@rh2.oracle.com (GEN0) 182016 2011-04-20 19:41:33
126,1 oracle@rh2.oracle.com (PSP0) 182016 2011-04-20 19:41:32
21,1 oracle@rh2.oracle.com (GTX0) 182016 2011-04-20 19:41:45
19,5 oracle@rh2.oracle.com (ARC2) 182016 2011-04-20 19:41:43
18,3 oracle@rh2.oracle.com (O001) 182016 2011-04-20 19:41:37
17,7 oracle@rh2.oracle.com (ARC0) 182016 2011-04-20 19:41:42
16,1 oracle@rh2.oracle.com (RSMN) 182016 2011-04-20 19:41:35
14,1 oracle@rh2.oracle.com (MMNL) 182016 2011-04-20 19:41:33
13,1 oracle@rh2.oracle.com (ASMB) 182016 2011-04-20 19:41:33
11,1 oracle@rh2.oracle.com (CKPT) 182016 2011-04-20 19:41:33
10,1 oracle@rh2.oracle.com (DBW0) 182016 2011-04-20 19:41:33
9,1 oracle@rh2.oracle.com (LMHB) 182016 2011-04-20 19:41:33
7,1 oracle@rh2.oracle.com (LMS1) 182016 2011-04-20 19:41:33
6,1 oracle@rh2.oracle.com (LMD0) 182016 2011-04-20 19:41:33
5,1 oracle@rh2.oracle.com (DIA0) 182016 2011-04-20 19:41:33
4,1 oracle@rh2.oracle.com (PING) 182016 2011-04-20 19:41:33
3,1 oracle@rh2.oracle.com (DIAG) 182016 2011-04-20 19:41:33
2,1 oracle@rh2.oracle.com (VKTM) 182016 2011-04-20 19:41:33
1,1 oracle@rh2.oracle.com (PMON) 182016 2011-04-20 19:41:32
Current total and average values of concurrent UGA memory usage:
14225504 bytes (total) and ~302670 bytes (average), for ~47 sessions.
Current SGA structure sizings:
Total System Global Area 939495424 bytes
Fixed Size 2232088 bytes
Variable Size 398459112 bytes
Database Buffers 532676608 bytes
Redo Buffers 6127616 bytes
Some initialization parameter values at instance startup:
large_pool_size=0
pga_aggregate_target=0
sga_target=0
shared_pool_size=0
sort_area_size=65536
streams_pool_size=0
Current Time: 2011.04.21-19:57:16
/* 可以从以上输出看到sid,serial=29,465会话的PGA内存使用量异常,达到了170M,
虽然跟以上案例中的PGA泄露情况比较不算什么 */
/* 使用sid和serial定位到具体的操作系统进程号 */
SQL> select spid,pid,PGA_USED_MEM,PGA_MAX_MEM from v$process
2 where addr=(select paddr from v$session where sid=&1 and serial#=&2);
Enter value for 1: 29
Enter value for 2: 465
old 2: where addr=(select paddr from v$session where sid=&1 and serial#=&2)
new 2: where addr=(select paddr from v$session where sid=29 and serial#=465)
SPID PID PGA_USED_MEM PGA_MAX_MEM
------------------------ ---------- ------------ -----------
26932 48 129716228 130034996
1 row selected.
SQL> oradebug setospid 26932;
Oracle pid: 48, Unix process pid: 26932, image: oracle@rh2.oracle.com (TNS V1-V3)
SQL> oradebug dump heapdump 536870917;
Statement processed.
SQL> oradebug dump processstate 10;
Statement processed.
SQL> oradebug tracefile_name;
/s01/orabase/diag/rdbms/prod/PROD1/trace/PROD1_ora_26932.trc
/* 接下来对堆转储文件进行分析,通过grep可以找出其中较大的SubHEAP子堆 */
[oracle@rh2 ~]$ egrep "HEAP DUMP heap name|Total heap size|Permanent space"
/s01/orabase/diag/rdbms/prod/PROD1/trace/PROD1_ora_26932.trc
HEAP DUMP heap name="session heap" desc=0x2ac0b37a67f8
Total heap size = 130840
Permanent space = 62680
HEAP DUMP heap name="Alloc environm" desc=0x2ac0b37ce090
Total heap size = 4040
Permanent space = 4040
HEAP DUMP heap name="PLS UGA hp" desc=0x2ac0b37be7f0
Total heap size = 1992
Permanent space = 1080
HEAP DUMP heap name="koh-kghu sessi" desc=0x2ac0b37cf660
Total heap size = 1128
Permanent space = 80
HEAP DUMP heap name="pga heap" desc=0xb7c8ba0
Total heap size = 2689432
Permanent space = 660560
HEAP DUMP heap name="Alloc environm" desc=0x2ac0b35ba5c8
Total heap size = 1706816
Permanent space = 464
HEAP DUMP heap name="Alloc server h" desc=0x2ac0b35b9000
Total heap size = 1704400
Permanent space = 1694816
HEAP DUMP heap name="diag pga" desc=0x2ac0b32537e0
Total heap size = 65448
Permanent space = 3672
HEAP DUMP heap name="KFK_IO_SUBHEAP" desc=0x2ac0b35eb2b0
Total heap size = 10992
Permanent space = 80
HEAP DUMP heap name="peshm.c:Proces" desc=0x2ac0b35e7ad0
Total heap size = 4000
Permanent space = 80
HEAP DUMP heap name="KSFQ heap" desc=0x2ac0b35c6d70
Total heap size = 3256
Permanent space = 3256
HEAP DUMP heap name="top call heap" desc=0xb7ce3c0
Total heap size =155918560
Permanent space = 448
HEAP DUMP heap name="callheap" desc=0xb7cd4c0
Total heap size =152906784
Permanent space = 80
HEAP DUMP heap name="TCHK^30c42b7a" desc=0x2ac0b378ff48
Total heap size =151414512
Permanent space = 80
HEAP DUMP heap name="kggec.c.kggfa" desc=0x2ac0b4e76ec8
Total heap size = 1016
Permanent space = 736
HEAP DUMP heap name="kxs-heap-c" desc=0x2ac0b37800c0
Total heap size = 1489464
Permanent space = 1485928
HEAP DUMP heap name="top uga heap" desc=0xb7ce5e0
Total heap size = 131024
Permanent space = 80
HEAP DUMP heap name="session heap" desc=0x2ac0b37a67f8
Total heap size = 130840
Permanent space = 62680
HEAP DUMP heap name="Alloc environm" desc=0x2ac0b37ce090
Total heap size = 4040
Permanent space = 4040
HEAP DUMP heap name="PLS UGA hp" desc=0x2ac0b37be7f0
Total heap size = 1992
Permanent space = 1080
HEAP DUMP heap name="koh-kghu sessi" desc=0x2ac0b37cf660
Total heap size = 1128
Permanent space = 80
HEAP DUMP heap name="SQLA^30c42b7a" desc=0x6f4c3ab8
Total heap size = 4919904
Permanent space = 80
HEAP DUMP heap name="KGLH0^30c42b7a" desc=0x6ef44290
Total heap size = 4032
Permanent space = 2648
/* 以上heapdump表明TCHK^30c42b7a子堆占用了PGA中绝大多数的内存,
其中子堆的包含结构为PGA->top call heap -> call heap -> TCHK
*/
/* 接着processstate dump还可以让我们了解该问题进程的最近活动历史,及之前所运行的SQL语句
以便进一步诊断,以下为其调用堆栈 */
ksedsts()+461<-ksdxfstk()+32<-ksdxcb()+1900<-sspuser()+112<-__sighandler()<-qcsfccc()+206
<-qcsIsColInFro()+309<-qcsRslvColWithinQbc()+179<-qcsWeakColRslv()+94<-qcsRslvName()+2541<-qcsridn()+105
<-qcsraic()+455<-qcspqbDescendents()+527<-qcspqb()+260<-qcspqbDescendents()+2744<-qcspqb()+260
<-kkmdrv()+182<-opiSem()+1947<-opiprs()+293<-__PGOSF632_kksParseChildCursor()+572<-rpiswu2()+1618
<-kksLoadChild()+5167<-kxsGetRuntimeLock()+2066<-kksfbc()+14527<-kkspsc0()+2025<-kksParseCursor()+144
<-opiosq0()+2027<-kpooprx()+274<-kpoal8()+800<-opiodr()+910<-ttcpip()+2289<-opitsk()+1670<-opiino()+966
<-opiodr()+910<-opidrv()+570<-sou2o()+103<-opimai_real()+133<-ssthrdmain()+252<-main()+201<-__libc_start_main()+244
<-_start()+36
通过以上获取的信息"call heap-> TCHK"可以从MOS查找到11.2上的”Bug 11782790: ORA-4030 IS GENERATED IN HARD PARSE"和"Bug 12360198: ORA-04030 (TCHK^82665CD8,CHEDEF : QCUATC)";虽然我们这里故意为之而非真实的Bug,也可以看出"TCHK subheap"在11.2中充当SQL解析时的临时调用子堆(parse call subheap)。
to be continued.....
Question :
1. How can we know available PGA and temporary tablespace before we issue a huge operation?
2. Can we estimate PGA and temporary tablespace for a huge operation?
3. As we know, there is limitation for a user process. Can we set unlimited and how to do it?
We say:
PROPOSED SOLUTION(S)
====================
ANSWER
======
Note 223730.1 Title Automatic PGA Memory Management in 9i and 10g
This Document briefly describes how Oracle 9i manage PGA work area and how to
tune it and some of the common issues and some of the common misunderstood issues.
Automatic PGA Memory Management
Automatic PGA Memory Management
***Checked for relevance on 07-Jan-2011***
note:note:
Automatic PGA Memory Management
——————————-
Process Global Area, often known as the Program Global Area (PGA) resides in the
process private memory of the server process. It contains global variables and data
structures and control information for a server process. example of such information
is the runtime area of a cursor. Each time a cursor is executed, a new runtime
area is created for that cursor in the PGA memory region of the server process
executing that cursor.
The performance of complex long running queries, typical in a DSS environment,
depend to a large extent on the memory available in the Program Global Area (PGA).
which is also called work area.
The size of a work area can be controlled and tuned. Generally, bigger work areas
can significantly improve the performance of a particular operator at the cost of
higher memory consumption. Ideally, the size of a work area is big enough that it
can accommodate the input data and auxiliary memory structures allocated by its
associated SQL operator. This is known as the optimal size of a work area (e.g.
a memory sort). When the size of the work area is smaller than optimal
(e.g. a disk sort), the response time increases, because an extra pass is performed
over part of the input data. This is known as the one-pass size of the work area.
Under the one-pass threshold, when the size of a work area is far too small compared
to the input data size, multiple passes over the input data are needed. This could
dramatically increase the response time of the operator. This is known as the multi-pass
size of the work area.
In Oracle8i administrators sized the PGA by carefully adjusting a number of
initialization parameters, such as, SORT_AREA_SIZE, HASH_AREA_SIZE,
BITMAP_MERGE_AREA_SIZE, and CREATE_BITMAP_AREA_SIZE, etc.
Starting with Oracle9i, an option is provided to completely automate the
management of PGA memory. Administrators merely need to specify the
maximum amount of PGA memory available to an instance using a newly
introduced initialization parameter PGA_AGGREGATE_TARGET.
The database server automatically distributes this memory among various
active queries in an intelligent manner so as to ensure maximum performance
benefits and the most efficient utilization of memory. Furthermore, Oracle9i
and newer releases can adapt itself to changing workload thus utilizing
resources efficiently regardless of the load on the system. The amount of
the PGA memory available to an instance can be changed dynamically by
altering the value of the PGA_AGGREGATE_TARGET parameter making it possible
to add to and remove PGA memory from an active instance online. Since the
database engine itself is better equipped to determine SQL execution memory
requirements, database administrators should use this feature and not try
to tune the PGA manually. This should translate to better throughput for
large number of users on the system as well as improved response time for
queries.
The automatic SQL execution memory management feature is enabled by setting the
parameter WORKAREA_SIZE_POLICY to AUTO and by specifying a size of
PGA_AGGREGATE_TARGET in the initialization file. These two parameters can also be
set dynamically using the ALTER SYSTEM command. In the absence of either of these
parameters, the database will revert to manual PGA management mode. In Oracle9i
Release 2, an advisory for PGA_AGGREGATE_TARGET was introduced. Just like in Buffer
Cache Advisory, the PGA Advisory will suggest the appropriate size for PGA memory
and thus make PGA tuning an even simpler task.
Version specific notes:
Until 9iR2, PGA_AGGREGATE_TARGET parameter controls the sizing of workareas for
all dedicated server connections, but it has no effect on shared servers (aka
MTS) connections and the *_AREA_SIZE parameters will take precedence in this
case.
In 10g, PGA_AGGREGATE_TARGET controls workareas allocated by both dedicated and
shared connections.
As of 11g, Automatic Memory Management (AMM) expands to managing both SGA and
PGA memory. Under memory pressure for PGA memory, SGA memory will be
re-allocated for use by a process to accommodate workarea needs. On the
flip-side, if PGA memory is under allocated, memory can be added to the
auto-tuned components in the SGA beyond the original SGA configuration.
NOTE: With AMM, setting an explicit value for PGA_AGGREGATE_TARGET will
act as a minimum setting that AMM will not shrink below. See note:443746.1
for more information.
How To Tune PGA_AGGREGATE_TARGET
———————————-
The first question we will have when we set this parameter is what is the best
value for it?
To determine the appropriate setting for PGA_AGGREGATE_TARGET parameter we
recommend to follow the following steps
1- Make a first estimate for PGA_AGGREGATE_TARGET based on the following rule
– For OLTP systems
PGA_AGGREGATE_TARGET = ( * 80%) * 20%
– For DSS systems
PGA_AGGREGATE_TARGET = ( * 80%) * 50%
So for example, if we have an Oracle instance configured on system with 16G of
Physical memory, then the suggested PGA_AGGREGATE_TARGET parameter value we
should start with incase we have OLTP system is (16 G * 80%)*20% ~= 2.5G and
incase we have DSS system is (16 G * 80%)* 50% ~= 6.5 G.
In the above equation, we assume that 20% of the memory will be used by the OS,
and in OLTP system 20% of the remaining memory will be used for
PGA_AGGREGATE_TARGET and the remaining memory is going for Oracle SGA
memory and non-oracle processes memory. So make sure that you have
enough memory for your SGA and also for non-oracle processes
2- A second step in tuning the PGA_AGGREGATE_TARGET is to monitor performance
using available PGA statistics and see if PGA_AGGREGATE_TARGET is under sized
or over sized. Several dynamic performance views are available for this
purpose:
– V$PGASTAT
This view provides instance-level statistics on the PGA memory usage and
the automatic PGA memory manager. For example:
SELECT * FROM V$PGASTAT;
NAME VALUE
——————————————————–
aggregate PGA target parameter 524288000 bytes
aggregate PGA auto target 463435776 bytes
global memory bound 25600 bytes
total PGA inuse 9353216 bytes
total PGA allocated 73516032 bytes
maximum PGA allocated 698371072 bytes
total PGA used for auto workareas 0 bytes
maximum PGA used for auto workareas 560744448 bytes
total PGA used for manual workareas 0 bytes
maximum PGA used for manual workareas 0 bytes
over allocation count 0 bytes
total bytes processed 4.0072E+10 bytes
total extra bytes read/written 3.1517E+10 bytes
cache hit percentage 55.97 percent
Main statistics to look at
(a) aggregate PGA auto target : This gives the amount of PGA memory Oracle can
use for work areas running in automatic mode. This part of memory represent the
tunable part of PGA memory,i.e. memory allocated for intensive memory SQL operators
like sorts, hash-join, group-by, bitmap merge and bitmap index create. This memory
part can be shrinked/expanded in function of the system load. Other parts of
PGA memory are known as untunable, i.e. they require a size that can’t be negociated
(e.g. context information for each session, for each open/active cursor,
PL/SQL or Java memory).
So, the aggregate PGA auto target should not be small compared to the value of
PGA_AGGREGATE_TARGET. You must ensure that enough PGA memory is left for work areas
running in automatic mode.
(b) total PGA used for auto workarea: This gives the actual tunable PGA memory used by
the system. The ‘maximum PGA used for auto workareas’ gives the maximum reached
by previous statistic since instance startup.
(c) total PGA in used: This gives the total PGA memory in use. The detail of this
value can be found in the PGA_USED_MEM column of the v$process view.
Oracle92, 10g, 11g:
(d) over allocation count: Over-allocating PGA memory can happen if the value of
PGA_AGGREGATE_TARGET is too small to accommodate the untunable PGA memory part plus
the minimum memory required to execute the work area workload. When this happens,
Oracle cannot honor the initialization parameter PGA_AGGREGATE_TARGET, and extra
PGA memory needs to be allocated. over allocation count is the number of time the
system was detected in this state since database startup. This count should ideally be
equal to zero.
Oracle92,10g, 11g:
(e) cache hit percentage: This metric is computed by Oracle to reflect the
performance of the PGA memory component. It is cumulative from instance
start-up. A value of 100% means that all work areas executed by the system
since instance start-up have used an optimal amount of PGA memory. This is,
of course, ideal but rarely happens except maybe for pure OLTP systems. In
reality, some work areas run one-pass or even multi-pass, depending on the
overall size of the PGA memory. When a work area cannot run optimally, one or
more extra passes is performed over the input data. This reduces the cache
hit percentage in proportion to the size of the input data and the number of
extra passes performed. this value if computed from the “total bytes processed”
and “total extra bytes read/written” statistics available in the same view using
the following formula:
total bytes processed * 100
PGA Cache Hit Ratio = ——————————————————
(total bytes processed + total extra bytes read/written)
– V$SQL_WORKAREA_HISTOGRAM (Oracle92, 10g, 11g)
This view shows the number of work areas executed with optimal memory size, one-
pass memory size, and multi-pass memory size since instance start-up. Statistics
in this view are subdivided into buckets that are defined by the optimal memory
requirement of the work area. Each bucket is identified by a range of optimal
memory requirements specified by the values of the columns LOW_OPTIMAL_SIZE and
HIGH_OPTIMAL_SIZE.
Example :
The following query shows statistics for all nonempty buckets.
SELECT LOW_OPTIMAL_SIZE/1024 low_kb,(HIGH_OPTIMAL_SIZE+1)/1024 high_kb,
optimal_executions, onepass_executions, multipasses_executions
FROM v$sql_workarea_histogram
WHERE total_executions != 0;
The result of the query might look like the following:
LOW_KB HIGH_KB OPTIMAL_EXECUTIONS ONEPASS_EXECUTIONS MULTIPASSES_EXECUTIONS
—— ——- —————— —————— ———————-
8 16 156255 0 0
16 32 150 0 0
32 64 89 0 0
64 128 13 0 0
128 256 60 0 0
256 512 8 0 0
512 1024 657 0 0
1024 2048 551 16 0
2048 4096 538 26 0
4096 8192 243 28 0
8192 16384 137 35 0
16384 32768 45 107 0
32768 65536 0 153 0
65536 131072 0 73 0
131072 262144 0 44 0
262144 524288 0 22 0
The query result shows that, in the 1024 KB to 2048 KB bucket, 551 work areas used
an optimal amount of memory, while 16 ran in one-pass mode and none ran in
multi-pass mode. It also shows that all work areas under 1 MB were able to run in
optimal mode.
You can also use V$SQL_WORKAREA_HISTOGRAM to find the percentage of times work
areas were executed in optimal, one-pass, or multi-pass mode since start-up.
Example :
SELECT optimal_count, round(optimal_count*100/total, 2) optimal_perc,
onepass_count, round(onepass_count*100/total, 2) onepass_perc,
multipass_count, round(multipass_count*100/total, 2) multipass_perc
FROM
(SELECT decode(sum(total_executions), 0, 1, sum(total_executions)) total,
sum(OPTIMAL_EXECUTIONS) optimal_count,
sum(ONEPASS_EXECUTIONS) onepass_count,
sum(MULTIPASSES_EXECUTIONS) multipass_count
FROM v$sql_workarea_histogram
WHERE low_optimal_size > 64*1024); —- for 64 K optimal size
– V$SQL_WORKAREA_ACTIVE
This view can be used to display the work areas that are active (or executing)
in the instance. Small active sorts (under 64 KB) are excluded from the view.
Use this view to precisely monitor the size of all active work areas and to
determine if these active work areas spill to a temporary segment.
Example :
SELECT to_number(decode(SID, 65535, NULL, SID)) sid,
operation_type OPERATION,trunc(EXPECTED_SIZE/1024) ESIZE,
trunc(ACTUAL_MEM_USED/1024) MEM, trunc(MAX_MEM_USED/1024) “MAX MEM”,
NUMBER_PASSES PASS, trunc(TEMPSEG_SIZE/1024) TSIZE
FROM V$SQL_WORKAREA_ACTIVE
ORDER BY 1,2;
SID OPERATION ESIZE MEM MAX MEM PASS TSIZE
— —————– ——— ——— ——— —– ——-
8 GROUP BY (SORT) 315 280 904 0
8 HASH-JOIN 2995 2377 2430 1 20000
9 GROUP BY (SORT) 34300 22688 22688 0
11 HASH-JOIN 18044 54482 54482 0
12 HASH-JOIN 18044 11406 21406 1 120000
This output shows that session 12 (column SID) is running a hash-join having its
work area running in one-pass mode (PASS column). This work area is currently
using 11406 KB of memory (MEM column) and has used, in the past, up to 21406 KB
of PGA memory (MAX MEM column). It has also spilled to a temporary segment of
size 120000 KB. Finally, the column ESIZE indicates the maximum amount of memory
that the PGA memory manager expects this hash-join to use. This maximum is dynamically
computed by the PGA memory manager according to workload.
When a work area is deallocated—that is, when the execution of its associated SQL
operator is complete—the work area is automatically removed from the
V$SQL_WORKAREA_ACTIVE view.
– note: have some other queries we use to monitor SQL execution memory
3- The Third and last step is tuning the PGA_AGGREGATE_TARGET. In Oracle 9i
Release 2 we have 2 new views that help us in this task
– V$PGA_TARGET_ADVICE
– V$PGA_TARGET_ADVICE_HISTOGRAM
By examining these two views, you will be able to determine how key PGA statistics
will be impacted if you change the value of PGA_AGGREGATE_TARGET.
To enable automatic generation of PGA advice performance views, make sure the
following parameters are set:
– PGA_AGGREGATE_TARGET
– STATISTICS_LEVEL. Set this to TYPICAL (the default) or ALL; setting this
parameter to BASIC turns off generation of PGA performance advice views.
The content of these PGA advice performance views is reset at instance start-up
or when PGA_AGGREGATE_TARGET is altered. NOTE: PGA_AGGREGATE can change
automatically over time starting with 11g as part of the Automatic Memory
Management enhancements available at 11g. See note:443746.1 for more
details.
V$PGA_TARGET_ADVICE view predicts how the statistics cache hit percentage and
over allocation count in V$PGASTAT will be impacted if you change the value of
the initialization parameter PGA_AGGREGATE_TARGET.
The following select statement can be used to find this information
SELECT round(PGA_TARGET_FOR_ESTIMATE/1024/1024) target_mb,
ESTD_PGA_CACHE_HIT_PERCENTAGE cache_hit_perc,
ESTD_OVERALLOC_COUNT
FROM v$pga_target_advice;
The output of this query might look like the following:
TARGET_MB CACHE_HIT_PERC ESTD_OVERALLOC_COUNT
———- ————– ——————–
63 23 367
125 24 30
250 30 3
375 39 0
500 58 0
600 59 0
700 59 0
800 60 0
900 60 0
1000 61 0
1500 67 0
2000 76 0
3000 83 0
4000 85 0
From the above results we should set the PGA_AGGREGATE_TARGET parameter to a
value where we avoid any over allocation, so lowest PGA_AGGREGATE_TARGET value
we can set is 375 ( where ESTD_OVERALLOC_COUNT is 0)
After eliminating over-allocations, the goal is to maximize the PGA cache hit
percentage, based on your response-time requirement and memory constraints.
V$PGA_TARGET_ADVICE_HISTOGRAM view predicts how the statistics displayed
by the performance view V$SQL_WORKAREA_HISTOGRAM will be impacted if you
change the value of the initialization parameter PGA_AGGREGATE_TARGET. You can
use the dynamic view V$PGA_TARGET_ADVICE_HISTOGRAM to view detailed
information on the predicted number of optimal, one-pass and multi-pass work
area executions for the set of PGA_AGGREGATE_TARGET values you use for the
prediction.
Common issues
—————
1- When we set the PGA_AGGREGATE_TARGET and WORKAREA_SIZE_POLICY to auto
then the *_area_size parameter are automatically ignored and oracle will
automatically use the computed value for these parameters.
2- In Oracle 8i and earlier, the PGA memory was static, once the process started
and started to allocate memory for it’s PGA area then it will not release it
back to the OS unless the process exits or dies. But the OS and under heavy
memory pressure will decide to page out unused memory pages belongs to a process
PGA to the swap space.
In Oracle 9i and under the automatic PGA memory management, Oracle will be able
to unallocate memory from a process PGA which is not using it any more so
another process can use it, also it can adjust the different work areas size
to accommodate the current workload and the amount of memory can be used.
3- Using automatic PGA memory management feature will help limiting resources
used by oracle process, and will use it more efficiently.
4- Using automatic PGA memory management will help also reducing the possibility
of getting ora-4030 errors unless we hit a OS limit, because work area sizes
will be controlled and adjusted automatically based on the PGA_AGGGREGATE_TARGET
parameter first and then the current work load.
5- If column ESTD_OVERALLOCATION_COUNT in the V$PGA_TARGET_ADVICE VIEW is nonzero,
It indicates that PGA_AGGREGATE_TARGET is too small to even meet the minimum
PGA memory needs. If PGA_AGGREGATE_TARGET is set within the over allocation
zone, the memory manager will over-allocate memory and actual PGA memory
consumed will be more than the limit you set. It is therefore meaningless to
set a value of PGA_AGGREGATE_TARGET in that zone.
6- Some customer reported that SQL LOADER in Oracle 9i is slower than SQL Loader
in Oracle 8i, and example of this is bug: which was closed as not a
bug. Using PGA_AGGREGATE_TARGET alleviated the problem.
7- PGA_AGGREGATE_TARGET is not supported on VMS, for more information please refer
to note: “Oracle9i Release Notes Release 1 (9.0.1) for Alpha OpenVMS”.
ORA-3113 is returned on instance startup when init.ora PGA_AGGREGATE_TARGET is set.
8- Setting PGA_AGGREGATE_TARGET in 9.0.1 on HP-UX 11.0 may panic the OS. for
more information please refer to note: “ALERT HP-UX Patch Levels
Advised” and Bug:2122307.
Known Bugs
———–
– bug:
Details: Attempting to set pga_aggregate_target over 4000Gb should error with
ORA-4032 but no error is signalled.
Fixed-Releases: 9.2.0.1.0
– Bug:2122307 HP System crash when setting PGA_AGGREGATE_TARGET to 10M or more
in Oracle 9.0.1.
This is basically an OS Problem that cause the crash. The system call pattern
automatic PGA management is using causing HP/UX to try to extend fixed region
and leads to memory allocation failures.
To resolve the bug both this patch and PHKL_25188 (or later) must be installed.
As the DBA you need to get confirmation from your operating system administrator that the amount of memory reported as being in use by a process includes or does not include shared memory. If shared memory is included in the value displayed by the operating system utility, then the shared pool size must be deducted from that value to know how much private memory the process is actually using.
See note 174555.1 “UNIX Determining the Size of an Oracle Process”.
If an RDBMS user process is using more private memory than expected, then the DBA has three options:
– Do nothing
– Monitor the RDBMS iuser session to find out what SQL statements are being performed or were being performed by that RDBMS session. Using the SQL*Trace functionality of the database would normally be done if information from the end user cannot be obtained directly as to what they were doing since the memory usage was higher than expected or what they are doing right now.
– Kill that RDBMS user session.
PGA_AGGREGATE_TARGET does not set a hard limit on pga usage. It is only a target value used to dynamically size the process work areas. It also does not affect other areas of the pga that are allowed to grow beyond this limit.
There are certain areas of pga that cannot be controlled by initialization parameters. Such areas include pl/sql memory collections such as pl/sql tables and varrays.
Depending on the programming code and amount of data being handled these areas can grow very large (up to 20G internal limit on 10) and can consume large amounts of memory. This memory growth can be controlled by good programming practices. As an example, use LIMIT clause with BULK COLLECT.
Additionally, programming mistakes can also lead to excessive memory usage.
You can take steps to control the size of a process. However, from within the database framework you cannot place a hard limit on the size of a process by setting any initialization parameters or database configuration.
You can limit the size of a process from the OS side by setting kernel limits or user shell limits but this leads to the ORA-4030 and will cause transaction rollback.
As noted in bug 7279150, “… this is not a hard limit and that we will exceed it when it is undersized and the workload increases rapidly, such as when they start the workload for their testing or when they spawn a new set of sessions from their application servers.”
During the execution of SQL statements, server processes consume memory for various operations. Part of this memory is assigned to work areas for operations such as sorts and hash joins. Ideally, a work area should be large enough to support the SQL operation being performed. This size is known as the optimal size of a work area. When a work area is smaller than its optimal size, an extra pass is performed over part of the input data. This is known as the one-pass size of the work area. When the size of a work area is far too small compared to the input data size, multiple passes over the input data are needed. This is known as the multi-pass size of the work area. Operations performed in one-pass and multi-pass work area sizes increase response times, sometimes dramatically in the case of the latter.
You can set the size of the various work areas with individual initialization parameters but the same amount of memory is allocated to each process. So if your parameters are set to avoid any multi-pass operations, processes will be assigned this much memory even for operations that could run in a much smaller optimal size.
With Oracle9i, you can use the PGA_AGGREGATE_TARGET initialization parameter to assign memory that is shared by the server processes active in the instance and is automatically reallocated to the processes that currently need it. In the initial release of Oracle9i, additional information was added to various dynamic performance tables to help you monitor whether you had set a sufficiently high value for the PGA target. However, these statistics do not provide a lot of detail nor give you any guidance for setting a more appropriate value when it is under- or over-sized.
Additional statistics are available in Oracle9i Database Release 2 to help you monitor and tune the PGA_AGGREGATE_TARGET parameter. Some of these statistics are provided through new views and others through modified views. In this section of the lesson, you can find more details about managing your PGA memory with the views listed above.
The new statistics to help you monitor the performance of the PGA memory component for a particular value of PGA_AGGREGATE_TARGET are based on two concepts: work areas groups and a computed PGA cache hit percentage value.
By grouping work areas based on their optimal memory requirement, statistics can be collected for each group based on the number of optimal, one-pass, and multi-pass executions for each of these work area groups. With this finer granularity of work area statistics than previously available, you can more accurately predict how much memory is required across the instance to maximize the number of optimal executions.
The PGA cache hit percentage summarizes statistics on work area executions into a single measure of PGA performance for a given value of PGA_AGGREGATE_TARGET. The PGA cache hit percentage is derived from the number of work areas that run optimal, the number of passes for the non-optimal work areas, and the sizes of the work areas.
The new view, v$sql_workarea_histogram, enables you to study the nature of the work area workload over a chosen time period. The work areas are split into 33 groups based on their optimal memory requirements. Each group is defined by the lower bound on its optimal memory requirement, displayed in the low_optimal_size column, and its upper bound, displayed in the high_optimal_size column. For each group, the view accumulates the number of executions using optimal, one-pass, multi-pass memory since instance start up. These are displayed in the optimal_executions, onepass-executions, and multipasses_executions columns respectively. The total_executions column contains the sum of the other three execution counts.
To determine if you have set a good value for the PGA target size, query the v$sql_workarea_histogram view using a statement such as the following, which converts the low_optimal_size and high_optimal_size column values to kilobytes:
SQL> SELECT low_optimal_size/1024 AS low_kb,
2 (high_optimal_size+1)/1024 AS high_kb,
3 ROUND(100*optimal_executions/total_executions) AS optimal,
4 ROUND(100*onepass_executions/total_executions) AS onepass,
5 ROUND(100*multipasses_executions/total_executions) AS multipass
6 FROM v$sql_workarea_histogram
7 WHERE total_executions != 0
8 ORDER by low_kb;
Of course, as with any monitoring effort using dynamic views, you should issue the query at the beginning and at the end of a typical work period and use the differences between the two results to determine what activity occurred during that period.
Although it would be ideal for all work areas to execute in the optimal size, this goal is typically achieved by over-allocating memory to the PGA. If you graph the results of your query as a histogram, you can quickly identify the location in the graph where work groups begin to use one-pass, or even multi-pass, sizes. In the example shown the former occurs with a work area size of about 200KB and the latter about 100MB. Based on your knowledge of the type of work being done and the current level of performance, you can decide if this is acceptable or if the PGA_AGGREGATE_TARGET parameter value should be changed.
If a work area runs in one-pass or multi-pass mode, extra bytes will be processed since one or more extra pass over the input data will be performed. A new statistic, PGA cache hit percentage, condenses in one global numerical metric the relative performance of the PGA memory component. The PGA cache hit percentage is the percentage formed from the ratio of the number of bytes that need to be processed when all work areas run in optimal mode to the total bytes really processed. The higher the PGA cache hit percentage, the better the performance of PGA memory and hence of the system.
The PGA cache hit percentage statistic is stored in the v$pgastat view and can be retrieved from the row with the value cache hit percentage in the name column. A sample query is shown above.
The v$sql_workarea and v$sql_workarea_active views have been modified in Oracle9i Database Release 2 to reflect information on the temporary segment an operator (work area) uses.
The v$sort_usage view is renamed to v$tempseg_usage to reflect that information about all temporary segments, not only sort segments, is recorded in this view. In the current release, the old view name is being maintained for backward compatibility.
If you monitor the PGA space consumption with the various views provided for that purpose (v$sql_workarea_histogram, v$pgastat, v$sql_workarea, and v$sql_workarea_active), you may decide that you need to reset your PGA_AGGREGATE_TARGET initialization parameter value to make better use of your available memory. In some cases, you may want to reduce the memory allocated, in other cases; you may realize that you should increase the value. To help you determine by what factor you should change the parameter value, you can use two new views, provided in Oracle9i Database Release 2, that provide PGA sizing advice. These views, v$pga_target_advice and v$pga_target_advice_histogram, accumulate advice statistics to help you tune the PGA_AGGREGATE_TARGET value. The views are only populated if PGA_AGGREGATE_TARGET is set to a non-zero value that enables auto management of the PGA. Also the initialization parameter STATISTICS_LEVEL value must be set to Typical or All. Further, the view contents are refreshed when you shut down the instance or when you change the value of PGA_AGGREGATE_TARGET dynamically.
Rows in these two views correspond to setting the PGA_AGGREGATE_TARGET value to 0.125, 0.25, 0.5, 0.75, 1, 1.2, 1.4, 1.6, 1.8, 2, 3, 4, 6, and 8 times its current value. However, if these values are either less than 10MB or more than 256GB, they will not be included in the output.
To begin monitoring and tuning the PGA target size, you should issue query against the v$pga_target_advice view similar to:
SQL> SELECT
2 ROUND(pga_target_for_estimate/1024/1024) AS target_mb,
3 estd_pga_cache_hit_percentage AS cache_hit_percent,
4 estd_overalloc_count
5 FROM v$pga_target_advice
6 ORDER BY target_mb;
For output that is easier to read and use, this query converts the value of the pga_target_for_estimate column from bytes to megabytes. As mentioned earlier, you should issue this query at the beginning and at the end of a typical work period and use the differences between the two results to obtain advise related to the work performed during that period.
The output from the query on v$pga_target_advice contains up to 14 rows that contain estimated statistics based on the multiples of the current PGA_AGGREGATE_TARGET value.
Assuming that your query produced the output shown above with the PGA_AGGREGATE_TARGET value set to 500MB, follow these steps to evaluate the results:
Step 1: Identify the first row with a value of zero in the estd_overallocation_count column. The rows above this one are for PGA_AGGREGATE_TARGET values (shown in the target_mb column) that are too small for the minimum PGA memory needs. In this case, this is the fifth row, which contains data for the current PGA_AGGREGATE_TARGET value, 500MB. Had the target_mb column value in the first row with a zero estd_overallocation_count been larger than the current setting, you should increase the PGA_AGGREGATE_TARGET parameter to at least this size.
Step 2: Examine the rows with PGA values larger than the minimum required to find the first pair of adjacent rows with values in the cache_hit_percent column that are within a few percentage points of each other. These rows indicate where, were you to graph the values, you would see an inflection point (sometimes referred to as a “knee”) in the curve. The optimal value for the PGA_AGGREGATE_TARGET parameter is at this inflection point, represented by the target_mb column value in the first of these two rows. Based on the above results, you should set the PGA_AGGREGATE_TARGET to 3000MB if you have sufficient memory. If you have even more memory available, you should assign it to some other use, such as one of the SGA components, rather than increasing the PGA target size.
11g中自动内存管理(Automatic Memory Management ,amm), 令dba在数据库内存配置的相关工作更加简单. AMM现在将SGA与PGA整合到一起管理,而您只需要设置memory_target参数即可限定Oracle将使用到的内存尺寸,Oracle将自动分配这些内存空间.
您一定很困惑Oracle在unix平台上是如何对共享的sga内存空间与私有的pga内存空间进行切换的?这意味着Oracle需要经常释放sga中的部分内存以便允许pga去使用它们.传统的sys V 使用的共享内存shm接口不具备如此的灵活性.我们来看看Oracle是如何做到的?
先来获取我们需要的11g实例共享内存id(shared memory id)
[oracle@rh2 ~]$ sysresv // 该命令需要设置了正确的LD_LIBRARY_PATH
IPC Resources for ORACLE_SID “T11” :
Shared Memory:
ID KEY
65537 0x95c84bb8
Semaphores:
ID KEY
327681 0xdf521034
Oracle Instance alive for sid “T11”
试着找出对应的sys V共享内存段:
[oracle@rh2 ~]$ ipcs -m
—— Shared Memory Segments ——–
key shmid owner perms bytes nattch status
0x95c84bb8 65537 oracle 660 4096 0
对应的存在着共享内存段,但该段很小只有 4096 byte哦,既然Oracle不再把sga放到共享段中,那藏到哪里去了呢?
我们接下来检查Oracle实例进程的内存影射状况.
[oracle@rh2 ~]$ pmap `pgrep -f lgwr`|less
14889: ora_lgwr_T11
0000000000400000 155016K r-x– /usr/oracle/product/11g/db_1/bin/oracle
0000000009c62000 12404K rw— /usr/oracle/product/11g/db_1/bin/oracle
000000000a87f000 732K rwx– [ anon ]
0000000060000000 4K r–s- /dev/shm/ora_T11_65537_0
0000000060001000 16380K rw-s- /dev/shm/ora_T11_65537_0
0000000061000000 16384K rw-s- /dev/shm/ora_T11_65537_1
0000000062000000 16384K rw-s- /dev/shm/ora_T11_65537_2
0000000063000000 16384K rw-s- /dev/shm/ora_T11_65537_3
0000000064000000 16384K rw-s- /dev/shm/ora_T11_65537_4
0000000065000000 16384K rw-s- /dev/shm/ora_T11_65537_5
0000000066000000 16384K rw-s- /dev/shm/ora_T11_65537_6
0000000067000000 16384K rw-s- /dev/shm/ora_T11_65537_7
0000000068000000 16384K rw-s- /dev/shm/ora_T11_65537_8
0000000069000000 16384K rw-s- /dev/shm/ora_T11_65537_9
000000006a000000 16384K rw-s- /dev/shm/ora_T11_65537_10
000000006b000000 16384K rw-s- /dev/shm/ora_T11_65537_11
000000006c000000 16384K rw-s- /dev/shm/ora_T11_65537_12
000000006d000000 16384K rw-s- /dev/shm/ora_T11_65537_13
000000006e000000 16384K rw-s- /dev/shm/ora_T11_65537_14
000000006f000000 16384K rw-s- /dev/shm/ora_T11_65537_15
0000000070000000 16384K rw-s- /dev/shm/ora_T11_65537_16
0000000071000000 16384K rw-s- /dev/shm/ora_T11_65537_17
0000000072000000 16384K rw-s- /dev/shm/ora_T11_65537_18
0000000073000000 16384K rw-s- /dev/shm/ora_T11_65537_19
0000000074000000 16384K rw-s- /dev/shm/ora_T11_65537_20
0000000075000000 16384K rw-s- /dev/shm/ora_T11_65537_21
0000000076000000 16384K rw-s- /dev/shm/ora_T11_65537_22
0000000077000000 16384K rw-s- /dev/shm/ora_T11_65537_23
0000000078000000 16384K rw-s- /dev/shm/ora_T11_65537_24
0000000079000000 16384K rw-s- /dev/shm/ora_T11_65537_25
000000007a000000 16384K rw-s- /dev/shm/ora_T11_65537_26
000000007b000000 16384K rw-s- /dev/shm/ora_T11_65537_27
000000007c000000 16384K rw-s- /dev/shm/ora_T11_65537_28
000000007d000000 16384K rw-s- /dev/shm/ora_T11_65537_29
000000007e000000 16384K rw-s- /dev/shm/ora_T11_65537_30
000000007f000000 16384K rw-s- /dev/shm/ora_T11_65537_31
0000000080000000 16384K rw-s- /dev/shm/ora_T11_65537_32
0000000081000000 16384K rw-s- /dev/shm/ora_T11_65537_33
0000000082000000 16384K rw-s- /dev/shm/ora_T11_65537_34
0000000083000000 16384K rw-s- /dev/shm/ora_T11_65537_35
0000000084000000 16384K rw-s- /dev/shm/ora_T11_65537_36
0000000085000000 16384K rw-s- /dev/shm/ora_T11_65537_37
0000000086000000 16384K rw-s- /dev/shm/ora_T11_65537_38
0000000087000000 16384K rw-s- /dev/shm/ora_T11_65537_39
0000000088000000 16384K rw-s- /dev/shm/ora_T11_65537_40
0000000089000000 16384K rw-s- /dev/shm/ora_T11_65537_41
000000008a000000 16384K rw-s- /dev/shm/ora_T11_65537_42
............
0000003e79109000 4K rw— /lib64/tls/librt-2.3.4.so
0000003e7910a000 64K rw— [ anon ]
0000003e79600000 84K r-x– /lib64/libnsl-2.3.4.so
0000003e79615000 1020K —– /lib64/libnsl-2.3.4.so
0000003e79714000 4K r—- /lib64/libnsl-2.3.4.so
0000003e79715000 4K rw— /lib64/libnsl-2.3.4.so
0000003e79716000 8K rw— [ anon ]
0000007fbfff3000 52K rwx– [ stack ]
ffffffffff600000 4K r-x– [ anon ]
total 2497724K
pmap工具诠释了进程相关共享内存的情况,可以看到许多个16MB的"文件"对应了Oracle服务进程的空间地址.这是linux上POSIX风格的共享内存管理模式,使用"文件"形式包含共享内存段.
借助于将sga分割成许多块,Oracle可以很容易地把sga部分内存返回给OS,而服务器进程即可以利用到这些内存.(当memory_max_target>1024时,颗粒为16MB,否则为4MB).
接下来我们测试下Oracle是如何释放部分sga内存的.
对比实例启动前后:
启动前:
[oracle@rh2 ~]$ ls -l /dev/shm
总用量 0
启动后:
[oracle@rh2 ~]$ ls -l /dev/shm
总用量 1373704
-rw-r—– 1 oracle oinstall 16777216 9月 27 18:59 ora_T11_327680_0
-rw-r—– 1 oracle oinstall 16777216 9月 27 18:59 ora_T11_327680_1
-rw-r—– 1 oracle oinstall 0 9月 27 18:59 ora_T11_327680_10
-rw-r—– 1 oracle oinstall 16777216 9月 27 18:59 ora_T11_327680_100
-rw-r—– 1 oracle oinstall 16777216 9月 27 18:59 ora_T11_327680_101
-rw-r—– 1 oracle oinstall 16777216 9月 27 18:59 ora_T11_327680_102
-rw-r—– 1 oracle oinstall 16777216 9月 27 18:59 ora_T11_327680_103
-rw-r—– 1 oracle oinstall 16777216 9月 27 18:59 ora_T11_327680_104
-rw-r—– 1 oracle oinstall 16777216 9月 27 18:59 ora_T11_327680_105
-rw-r—– 1 oracle oinstall 16777216 9月 27 18:59 ora_T11_327680_106
-rw-r—– 1 oracle oinstall 16777216 9月 27 18:59 ora_T11_327680_107
-rw-r—– 1 oracle oinstall 16777216 9月 27 18:59 ora_T11_327680_108
-rw-r—– 1 oracle oinstall 16777216 9月 27 18:59 ora_T11_327680_109
-rw-r—– 1 oracle oinstall 0 9月 27 18:59 ora_T11_327680_11
-rw-r—– 1 oracle oinstall 16777216 9月 27 18:59 ora_T11_327680_110
-rw-r—– 1 oracle oinstall 16777216 9月 27 18:59 ora_T11_327680_111
-rw-r—– 1 oracle oinstall 16777216 9月 27 18:59 ora_T11_327680_112
-rw-r—– 1 oracle oinstall 16777216 9月 27 18:59 ora_T11_327680_113
-rw-r—– 1 oracle oinstall 16777216 9月 27 18:59 ora_T11_327680_114
-rw-r—– 1 oracle oinstall 16777216 9月 27 18:59 ora_T11_327680_115
-rw-r—– 1 oracle oinstall 16777216 9月 27 18:59 ora_T11_327680_116
-rw-r—– 1 oracle oinstall 16777216 9月 27 18:59 ora_T11_327680_117
-rw-r—– 1 oracle oinstall 16777216 9月 27 18:59 ora_T11_327680_118
-rw-r—– 1 oracle oinstall 16777216 9月 27 18:59 ora_T11_327680_119
-rw-r—– 1 oracle oinstall 0 9月 27 18:59 ora_T11_327680_12
可以看到启动后出现的16MB文件形式共享内存中部分大小为0,这些块被选出当发生内存交换时来被’destory’.使用pmap工具仍可以看到该部分影射,而实际上已经被Oracle释放了.
现在我们加大pga,观察其交换情况.
SQL> alter system set pga_aggregate_target=1900M ;
System altered.
[oracle@rh2 ~]$ ls -l /dev/shm
总用量 289984
-rw-r—– 1 oracle oinstall 16777216 9月 27 18:59 ora_T11_327680_0
-rw-r—– 1 oracle oinstall 16777216 9月 27 18:59 ora_T11_327680_1
-rw-r—– 1 oracle oinstall 0 9月 27 18:59 ora_T11_327680_10
-rw-r—– 1 oracle oinstall 0 9月 27 19:09 ora_T11_327680_100
-rw-r—– 1 oracle oinstall 0 9月 27 19:09 ora_T11_327680_101
-rw-r—– 1 oracle oinstall 0 9月 27 19:09 ora_T11_327680_102
-rw-r—– 1 oracle oinstall 0 9月 27 19:09 ora_T11_327680_103
-rw-r—– 1 oracle oinstall 16777216 9月 27 18:59 ora_T11_327680_104
-rw-r—– 1 oracle oinstall 16777216 9月 27 18:59 ora_T11_327680_105
-rw-r—– 1 oracle oinstall 16777216 9月 27 18:59 ora_T11_327680_106
-rw-r—– 1 oracle oinstall 16777216 9月 27 18:59 ora_T11_327680_107
-rw-r—– 1 oracle oinstall 16777216 9月 27 18:59 ora_T11_327680_108
-rw-r—– 1 oracle oinstall 16777216 9月 27 18:59 ora_T11_327680_109
-rw-r—– 1 oracle oinstall 0 9月 27 18:59 ora_T11_327680_11
-rw-r—– 1 oracle oinstall 0 9月 27 19:09 ora_T11_327680_110
-rw-r—– 1 oracle oinstall 0 9月 27 19:09 ora_T11_327680_111
-rw-r—– 1 oracle oinstall 0 9月 27 19:09 ora_T11_327680_112
-rw-r—– 1 oracle oinstall 0 9月 27 19:09 ora_T11_327680_113
-rw-r—– 1 oracle oinstall 0 9月 27 19:09 ora_T11_327680_114
-rw-r—– 1 oracle oinstall 0 9月 27 19:09 ora_T11_327680_115
-rw-r—– 1 oracle oinstall 0 9月 27 19:09 ora_T11_327680_116
-rw-r—– 1 oracle oinstall 0 9月 27 19:09 ora_T11_327680_117
-rw-r—– 1 oracle oinstall 0 9月 27 19:09 ora_T11_327680_118
-rw-r—– 1 oracle oinstall 0 9月 27 19:09 ora_T11_327680_119
-rw-r—– 1 oracle oinstall 0 9月 27 18:59 ora_T11_327680_12
-rw-r—– 1 oracle oinstall 0 9月 27 19:09 ora_T11_327680_120
-rw-r—– 1 oracle oinstall 0 9月 27 19:09 ora_T11_327680_121
可以看到出现了大量size为0的"文件",期许的交换出现了.
可见在11g中Oracle采用了新的共享内存实现方式,区别于旧的"一块式"共享段,更为灵活了.
REM  Locate the top PGA user

set lines 75
set pages 999
set serveroutput on

spool topuser.out

select * from gv$version;

declare a1 number;
            a2 number;
            a3 varchar2(30);
            a4 varchar2(30);
            a5 number;
            a6 number;
            a7 number;
            a8 number;
            blankline varchar2(70);

cursor code is select pid, spid, substr(username,1,20) "USER" , substr(program,1,30) "Program",
PGA_USED_MEM, PGA_ALLOC_MEM, PGA_FREEABLE_MEM, PGA_MAX_MEM
from v$process where pga_alloc_mem=
(select max(pga_alloc_mem) from v$process
where program not like '%LGWR%');

begin
  blankline:=chr(13);
  open code;
  fetch code into a1, a2, a3, a4, a5, a6, a7, a8;

  dbms_output.put_line(blankline);
  dbms_output.put_line('               Top PGA User');
  dbms_output.put_line(blankline);

  dbms_output.put_line('PID:   '||a1||'             '||'SPID:   '||a2);
  dbms_output.put_line('User Info:           '||a3);
  dbms_output.put_line('Program:            '||a4);
  dbms_output.put_line('PGA Used:            '||a5);
  dbms_output.put_line('PGA Allocated:        '||a6);
  dbms_output.put_line('PGA Freeable:             '||a7);
  dbms_output.put_line('Maximum PGA:            '||a8);

end;
/

set lines 132
col value format 999,999,999,999,999

select * from v$pgastat;

spool off

REM
REM  Investigate memory from the database side
REM

col TTL format 999,999,999,999 heading "Total Memory"

break on report
compute sum on report of TTL

select bytes TTL from v$sgainfo where name='Maximum SGA Size'
union
select value from v$pgastat where name='total PGA allocated'
/

set lines 132
set pages 999

spool workareaoverview.out

REM overview of PGA usage

col name format a40 head "Name"
col value format 999,999,999 head "Total"
col unit format a10 head "Units"
col pga_size format a25 head "PGA Size"
col optimal_executions format 999,999,999,999 head "Optimal"
col onepass_executions format 999,999,999,999 head "One-Pass"
col multipasses_executions format 999,999,999,999 head "Multi-Pass"
col optimal_count format 999,999,999,999 head "Optimal Count"
col optimal_perc format 999 head "Optimal|PCT"
col onepass_count format 999,999,999,999 head "One-Pass Count"
col onepass_perc format 999 head "One|PCT"
col multipass_count format 999,999,999,999 head "Multi-Pass Count"
col multipass_perc format 999 head "Multi|PCT"

col sid format 999,999 Head "SID"
col operation format a30 head "Operation"
col esize format 999,999,999 head "Expected Size"
col mem format 999,999,999 head "Actual Mem"
col "MAX MEM" format 999,999,999 head "Maximum Mem"
col pass format 999,999 head "Passes"
col tsize format 999,999,999,999,999 head "Temporary|Segment Size"

spool workareaoverview.out

SELECT  name,  decode(unit, 'bytes', trunc(value/1024/1024), value) value ,
decode(unit, 'bytes', 'MBytes', unit) unit FROM V$PGASTAT
/

REM Review workarea buckets to see how efficient memory is utilized
REM  Ideal to see OPTIMAL EXECUTIONS vs. ONE-PASS and Multi-PASS

select case when low_optimal_size < 1024*1024
then to_char(low_optimal_size/1024,'999999') || 'kb  0
order by low_optimal_size
/

REM Review workarea buckets as percentages overall
REM      this script assuming 64K optimal size

SELECT optimal_count, round(optimal_count*100/total, 2) optimal_perc,
       onepass_count, round(onepass_count*100/total, 2) onepass_perc,
       multipass_count, round(multipass_count*100/total, 2) multipass_perc
FROM
       (SELECT decode(sum(total_executions), 0, 1, sum(total_executions)) total,
               sum(OPTIMAL_EXECUTIONS) optimal_count,
               sum(ONEPASS_EXECUTIONS) onepass_count,
               sum(MULTIPASSES_EXECUTIONS) multipass_count
        FROM   v$sql_workarea_histogram
        WHERE  low_optimal_size > 64*1024)
/

REM   Review current activity in Work Areas

SELECT to_number(decode(SID, 65535, NULL, SID)) sid,
       operation_type OPERATION,trunc(EXPECTED_SIZE/1024) ESIZE,
       trunc(ACTUAL_MEM_USED/1024) MEM, trunc(MAX_MEM_USED/1024) "MAX MEM",
       NUMBER_PASSES PASS, trunc(TEMPSEG_SIZE/1024) TSIZE
FROM V$SQL_WORKAREA_ACTIVE
ORDER BY 1,2
/

alter session set NLS_DATE_FORMAT='DD-MON-YYYY HH24:MI:SS';
select sysdate from dual;

select * from v$pgastat;

col time form a30
col name form a30
select a.BEGIN_INTERVAL_TIME time, b.*
from DBA_HIST_SNAPSHOT a, DBA_HIST_PGASTAT b
where a.SNAP_ID=b.SNAP_ID
and b.name='total PGA allocated'
order by a.BEGIN_INTERVAL_TIME desc
/

show parameter parallel_execution_message_size

show parameter memory

show parameter pga


spool off
clear col


#collect AIX info

ls -al $ORACLE_HOME/bin/oracle >> /tmp/support.txt
oslevel -s
whoami >> /tmp/support.txt
ulimit -a >> /tmp/support.txt
svmon -O unit=MB >> /tmp/support.txt
/usr/sbin/lsps -a >> /tmp/support.txt
/usr/sbin/lsattr -HE -l sys0 -a realmem >> /tmp/support.txt
ipcs -m >> /tmp/support.txt

opatch lsinventory -detail

#collect Linux info

arch
cat /etc/issue
whoami
ulimit -a
df -h /dev/shm
ipcs -ma
cat /etc/sysctl.conf
cat /proc/meminfo
cat /proc/swaps
cat /proc/vmstat
opatch lsinventory -detail
pga_aggregate_target is a target, as opposed to a hard limit – so it isn’t unusual to go above that.
13G above that, now that’s unusual though! There IS an enhancement request in,
to make a hard-limit setting, but that does not currently exist.
There is a known bug in 10203 with certain statements burning up memory – bug 5947623 – however,
the 10203/aix version of this patch is 64-bit, and the SR header says you are on 32-bit, so that isn’t
an option….and 10203 is old enough that I can’t get a new version of the patch made.
As I was unable to see any errors (e.g., ORA-4030) thre does not seem to be any problem with the operation of the database.
PGA_AGGREGATE_TARGET does not set a hard limit on pga usage. It is only a target value used to dynamically size the process work areas. It also does not affect other areas of the pga that are allowed to grow beyond this limit.
There are certain areas of pga that cannot be controlled by initialization parameters. Such areas include pl/sql memory collections such as pl/sql tables and varrays.
Depending on the programming code and amount of data being handled these areas can grow very large (up to 20G internal limit on 10) and can consume large amounts of memory. This memory growth can be controlled by good programming practices. As an example, use LIMIT clause with BULK COLLECT.
Additionally, programming mistakes can also lead to excessive memory usage.
You can take steps to control the size of a process. However, from within the database framework you cannot place a hard limit on the size of a process by setting any initialization parameters or database configuration.
You can limit the size of a process from the OS side by setting kernel limits or user shell limits but this leads to the ORA-4030 and will cause transaction rollback.
As noted in bug 7279150, “… this is not a hard limit and that we will exceed it when it is undersized and the workload increases rapidly, such as when they start the workload for their testing or when they spawn a new set of sessions from their application servers.”
As the DBA you need to get confirmation from your operating system administrator that the amount of memory reported as being in use by a process includes or does not include shared memory. If shared memory is included in the value displayed by the operating system utility, then the shared pool size must be deducted from that value to know how much private memory the process is actually using.
See note 174555.1 “UNIX Determining the Size of an Oracle Process”.
If an RDBMS user process is using more private memory than expected, then the DBA has three options:
– Do nothing
– Monitor the RDBMS iuser session to find out what SQL statements are being performed or were being performed by that RDBMS session. Using the SQL*Trace functionality of the database would normally be done if information from the end user cannot be obtained directly as to what they were doing since the memory usage was higher than expected or what they are doing right now.
– Kill that RDBMS user session.
