11gR2新特性:Heavy swapping observed on system in last 5 mins.

在11gR2中DBRM(database resource manager,11gR2中新的后台进程,见《Learning 11g New Background Processes》)会在Alert.log告警日志中反映OS操作系统最近5分钟是否有剧烈的swap活动了, 具体的日志如下:


WARNING: Heavy swapping observed on system in last 5 mins.
pct of memory swapped in [3.07%] pct of memory swapped out [4.44%].
Please make sure there is no memory pressure and the SGA and PGA
are configured correctly. Look at DBRM trace file for more details.


进一步诊断可以观察DBRM后台进程的trace:


[oracle@vrh2 trace]$ cat VPROD2_dbrm_5466.trc
Trace file /s01/orabase/diag/rdbms/vprod/VPROD2/trace/VPROD2_dbrm_5466.trc
Oracle Database 11g Enterprise Edition Release 11.2.0.3.0 - 64bit Production
With the Partitioning, Real Application Clusters, Automatic Storage Management, OLAP,
Data Mining and Real Application Testing options
ORACLE_HOME = /s01/orabase/product/11.2.0/dbhome_1
System name:    Linux
Node name:      vrh2.oracle.com
Release:        2.6.32-200.13.1.el5uek
Version:        #1 SMP Wed Jul 27 21:02:33 EDT 2011
Machine:        x86_64
Instance name: VPROD2
Redo thread mounted by this instance: 2
Oracle process number: 7
Unix process pid: 5466, image: oracle@vrh2.oracle.com (DBRM)

*** 2011-12-29 22:08:14.627
*** SESSION ID:(165.1) 2011-12-29 22:08:14.627
*** CLIENT ID:() 2011-12-29 22:08:14.627
*** SERVICE NAME:() 2011-12-29 22:08:14.627
*** MODULE NAME:() 2011-12-29 22:08:14.627
*** ACTION NAME:() 2011-12-29 22:08:14.627

kgsksysstop: blocking mode (2) timestamp: 1325214494612191
kgsksysstop: successful
kgsksysresume: successful

*** 2011-12-29 22:08:43.869
PQQ: Active Services changed
PQQ: Old service table
SvcIdx  SvcId Active ActDop
     5      5      1      0
     6      6      1      0
PQQ: New service table
SvcIdx  SvcId Active ActDop
     1      1      1      0
     2      2      1      0
     5      5      1      0
     6      6      1      0
2012-01-02 01:49:39.805820 : GSIPC:KSXPCB: msg 0x9bc353f0 status 34, type 12, dest 1, rcvr 0

*** 2012-01-02 01:49:54.509
PQQ: Skipping service checks
Trace file /s01/orabase/diag/rdbms/vprod/VPROD2/trace/VPROD2_dbrm_5466.trc
Oracle Database 11g Enterprise Edition Release 11.2.0.3.0 - 64bit Production
With the Partitioning, Real Application Clusters, Automatic Storage Management, OLAP,
Data Mining and Real Application Testing options
ORACLE_HOME = /s01/orabase/product/11.2.0/dbhome_1
System name:    Linux
Node name:      vrh2.oracle.com
Release:        2.6.32-200.13.1.el5uek
Version:        #1 SMP Wed Jul 27 21:02:33 EDT 2011
Machine:        x86_64
Instance name: VPROD2
Redo thread mounted by this instance: 2
Oracle process number: 7
Unix process pid: 5466, image: oracle@vrh2.oracle.com (DBRM)

*** 2012-01-03 03:05:54.518
*** SESSION ID:(165.1) 2012-01-03 03:05:54.518
*** CLIENT ID:() 2012-01-03 03:05:54.518
*** SERVICE NAME:() 2012-01-03 03:05:54.518
*** MODULE NAME:() 2012-01-03 03:05:54.518
*** ACTION NAME:() 2012-01-03 03:05:54.518

PQQ: Skipping service checks
kgsksysstop: blocking mode (2) timestamp: 1325577954530079
kgsksysstop: successful
kgsksysresume: successful

*** 2012-01-03 03:05:59.270
PQQ: Active Services changed
PQQ: Old service table
SvcIdx  SvcId Active ActDop
     5      5      1      0
     6      6      1      0
PQQ: New service table
SvcIdx  SvcId Active ActDop
     1      1      1      0
     2      2      1      0
     5      5      1      0
     6      6      1      0
PQQ: Checking service limits

*** 2012-01-07 02:06:51.856
PQQ: Skipping service checks
PQQ: Checking service limits

*** 2012-01-08 23:12:11.302
PQQ: Skipping service checks
Heavy swapping observed in last 5 mins:    [pct of total memory][bytes]

*** 2012-01-09 22:39:51.619
total swpin [ 3.07%][124709K], total swpout [ 4.44%][180120K]
vm stats captured every 30 secs for last 5 mins:
swpin:                 swpout:  
[ 0.27%][     11096K]  [ 0.25%][     10451K]
[ 0.27%][     11240K]  [ 0.29%][     12000K]
[ 0.29%][     12001K]  [ 0.02%][       853K]
[ 0.16%][      6849K]  [ 0.02%][       966K]
[ 0.53%][     21604K]  [ 0.09%][      4031K]
[ 0.10%][      4415K]  [ 0.03%][      1414K]
[ 0.43%][     17808K]  [ 0.37%][     15016K]
[ 0.64%][     25972K]  [ 1.61%][     65515K]
[ 0.26%][     10560K]  [ 0.88%][     36051K]
[ 0.07%][      3164K]  [ 0.83%][     33823K]


可以看到dbrm收集到了短期内的swapin和swapout数据,这样便于我们诊断由swap造成的性能或者hang问题。


解决OS 系统严重swap的一些思路:

1.  诊断是否存在内存泄露的进程,解决内存泄露
2.  调优SGA/PGA ,减少oracle对内存的占用
3.  利用  echo 3 > /proc/sys/vm/drop_caches 命令可以暂时释放一些cache的内存
4. 调整系统VM内存管理参数, 例如Linux上sysctl.conf中的以下几个参数

vm.min_free_kbytes   :Raising the value in /proc/sys/vm/min_free_kbytes will cause the system to start reclaiming memory at an earlier time than it would have before.

vm.vfs_cache_pressure :        At the default value of vfs_cache_pressure = 100 the kernel will attempt to reclaim dentries and inodes at a “fair” rate with respect to pagecache and swapcache reclaim. Decreasing vfs_cache_pressure causes the kernel to prefer to retain dentry and inode caches. Increasing vfs_cache_pressure beyond 100 causes the kernel to prefer to reclaim dentries and inodes.

vm.swappiness  : default 60 ;Apparently /proc/sys/vm/swappiness on Red Hat Linux allows the admin to tune how aggressively the kernel swaps out processes’ memory. Decreasing the  swappiness setting may result in improved Directory performance as the kernel
holds more of the server process in memory longer before swapping it out.

设置以下值,减少out of memory的可能性:

# Oracle-Validated setting for vm.min_free_kbytes is 51200 to avoid OOM killer
vm.min_free_kbytes = 51200
#vm.swappiness = 40
vm.vfs_cache_pressure = 200
RAC中增大db_cache_size引发的ORA-04031错误

几个礼拜前, 有一套10.2.0.2 的 二节点RAC 数据库因为增大db_cache_size , 引发其中一个实例发生著名的ORA-04031 错误,日志如下:


Errors in file /oracle/oracle/admin/maclean/udump/u1_ora_13757.trc:
ORA-00603: ORACLE server session terminated by fatal error
ORA-00604: error occurred at recursive SQL level 1
ORA-04031: unable to allocate 1048 bytes of shared memory
("shared pool","select name,online$,contents...","Typecheck","kgghteInit")
ORA-00604: error occurred at recursive SQL level 1
ORA-04031: unable to allocate 1048 bytes of shared memory
("shared pool","select name,online$,contents...","Typecheck","seg:kggfaAllocSeg")
Thu Oct 13 08:25:05 2011
Log from www.askmac.cn  & www.askmac.cn
Errors in file /oracle/oracle/admin/maclean/udump/u1_ora_1444.trc:
ORA-00603: ORACLE server session terminated by fatal error
ORA-00604: error occurred at recursive SQL level 1
ORA-04031: unable to allocate 4120 bytes of shared memory
("shared pool","select name,online$,contents...","Typecheck","kgghtInit")
ORA-00604: error occurred at recursive SQL level 1
ORA-04031: unable to allocate 4120 bytes of shared memory
("shared pool","select name,online$,contents...","Typecheck","kgghtInit")


以上错误出现的同时实例出现大量的row cache lock字典缓存和cursor:pin S wait on X等待事件,说明共享池中的row cache字典缓存和SQL area 执行计划因为Free Memory不足而被不断换出,导致硬解析增多并SQL解析性能下降,进一步造成了应用程序挂起,赶到现场后对该ORA-04031错误进行了分析。

SGA中的内存池包含不同大小的内存块。当数据库启动时,会有一块大的内存被分配并使用Free list的空闲列表追踪。随着时间推移,这些内存被不断分配和释放,内存块(chunk)被按照其大小在不同的Fress list中移动,当SGA里任何一个内存池出现不能满足内部分配一整块连续的内存块请求时,就可能出现ORA-04031错误。实际使用中造成ORA-04031错误的原因可能是Oracle软件bug、产品缺陷、应用程序设计不当、Oracle内存参数设置不当。


这里出现ORA-04031错误的内存池是shared pool即共享池,为了搞清楚ORA-04031错误发生的实际原因,我们通过AWR报告分析共享池的使用情况。


以下是 ORA-04031 问题发生前一天AWR报告中的共享池内存使用情况:


Pool Name Begin MB End MB % Diff
large free memory 112.00 112.00 0.00
shared ASH buffers 25.60 25.60 0.00
shared CCursor 19.44 20.16 3.70
shared Checkpoint queue 5.87 5.87 0.00
shared PCursor 10.57 11.14 5.38
shared event statistics per sess 7.72 7.72 0.00
shared free memory 32.99 33.00 0.02
shared gcs resources 78.75 78.75 0.00
shared gcs shadows 49.61 49.61 0.00
shared ges big msg buffers 15.03 15.03 0.00
shared ges reserved msg buffers 7.86 7.86 0.00
shared ges resource 5.28 5.28 0.00
shared kglsim heap 16.63 16.63 0.00
shared kglsim object batch 25.63 25.63 0.00
shared library cache 21.32 22.01 3.23
shared row cache 7.13 7.13 0.00
shared sql area 64.06 61.55 -3.91
streams free memory 64.00 64.00 0.00
buffer_cache 3,936.00 3,936.00 0.00
fixed_sga 2.08 2.08 0.00
log_buffer 3.09 3.09 0.00


以下是 ORA-04031 问题发生时AWR报告中的共享池内存使用情况:


Pool Name Begin MB End MB % Diff
large free memory 112.00 112.00 0.00
shared ASH buffers 25.60 25.60 0.00
shared Checkpoint queue 5.87 5.87 0.00
shared KCL name table 9.00 9.00 0.00
shared event statistics per sess 7.72 7.72 0.00
shared free memory 25.56 25.52 -0.12
shared gcs resources 143.39 143.39 0.00
shared gcs shadows 90.33 90.33 0.00
shared ges big msg buffers 15.03 15.03 0.00
shared ges reserved msg buffers 7.86 7.86 0.00
shared library cache 7.59 7.65 0.80
shared row cache 7.13 7.13 0.00
shared sql area 8.70 7.35 -15.57
streams free memory 64.00 64.00 0.00
buffer_cache 7,168.00 7,168.00 0.00
fixed_sga 2.09 2.09 0.00
log_buffer 3.09 3.09 0.00


红色部分标注了2个报告中差异最大的地方,在问题发生时共享池中gcs resources和gcs shadows 2种资源对比前一天增长了169M。 gcs资源在共享池中享有较高的优先级, 而普通的SQL语句或执行计划享有较低的优先级,因为gcs资源所占用空间的大量膨胀,导致在没有调大共享池大小的情况下sql area和row cache内存资源被换出进而引发SQL解析性能下降和ORA-04031问题。


gcs resources和gcs shadow资源均是Oracle RAC中特有的全局缓存服务资源,这些资源负责处理RAC中的全局buffer cache。 同时这些资源所占用共享池的空间视乎Oracle实例所使用高速缓存的大小而决定,Metalink文档说明了该问题:


“The ‘gcs resources’ and ‘gcs shadows’ structures are used for handling buffer caches in RAC, so their memory usages are depending on buffer cache size. We can use V$RESOURCE_LIMIT to monitor them.”


当实例高速缓存buffer cache被大小时gcs资源所占用的空间也相应增长,具体算法如下:


‘gcs_resources’ = initial_allocation * 120 bytes = “_gcs_resources parameter” * 120 bytes
‘gcs_shadows’ = initial_allocation * 72 bytes = “_gcs_shadow_locks parameter” * 72 bytes

select * from v$resource_limit where resource_name like '%gcs%';

RESOURCE_NAME CURRENT_UTILIZATION MAX_UTILIZATION INITIAL_ALLOCATION LIMIT_VALUE
------------------------------ ------------------- --------------- ---
gcs_resources 507772 514607 976083 976083
gcs_shadows 133862 139927 976083 976083


我们可以通过现有的v$resource_limit视图中的INITIAL_ALLOCATION估算Buffer cache增加后的INITIAL_ALLOCATION数量,例如我们准备将db_cache_size从10g增加到20g,那么可以通过下列公式算出有必要增加的共享池大小:


add_to_shared_pool_size= 140 * Buffer_cache增加的兆数 * 192 bytes * 1.6

= 140 * 10* 1024 * 192 * 1.6 = 440401920 = 420M


问题总结


由于RAC环境中Oracle 使用共享池中的gcs resource/shadow 资源管理 全局缓存 , 当实例的Buffer Cache总量增加时gcs resource/shadow 这些资源的数目也会相应上升 , 这导致共享池中可用的剩余空间大幅下降,又因为 gcs 全局缓存资源在共享池中享有较高的优先级( perm ,且在10.2中 gcs资源不能和其他如row cache或library cache 共享一个Extent的内存区间) , 引发了大量的row/dictionary cache字典缓存和SQL执行计划被换出共享池, 引发大量的解析等待: cursor pin s on x 和 row cache lock ,  最终还是 没有避免ORA-04031 的错误被触发。 这里要补充一句, 因为这套10g 的系统没有 启用ASMM(Automatic Shared Memory Management) 特性 且 共享池本身设置地较小(shared_pool_size=512MB) , 都是导致该ORA-04031 错误较为显性地被触发的因素 。


<深入了解ASMM>中我介绍了ASMM的一些优点, 这里再罗列一下:

手动管理SGA的缺点在于:

  • 个别组件如shared pool、default buffer pool的大小存在最优值,但组件之间无法交换内存
  • 在9i中就提供了多种内存建议(advisor),但都要求人工手动干预
  • 无法适应工作负载存在变化的环境
  • 往往会导致内存浪费,没有用到实处
  • 若设置不当,引发著名的ORA-04031错误的可能性大大提高

ASMM自动管理SGA的优势在于:

  • 全自动的共享内存管理
  • 无需再配置每一个内存组件大小参数
  • 仅使用一个参数sga_target驱动
  • 有效利用所有可用的内存,极大程度上减少内存浪费
  • 对比MSMM其内存管理模式:
    • 更加动态
    • 更加灵活
    • 并具备适应性
  • 易于使用
  • 一定程度上增强了性能,因为内存分配更为合理了
  • 当某个组件急需更多内存时可以有效提供,因此可以一定程度避免ORA-04031的发生


解决方案


可以通过以下2种方式避免该RAC环境中特有的由增大Buffer_Cache导致GCS资源空间膨胀造成的ORA-04031问题:

  1. 在增加Buffer_Cache的同时估算所需相应增长的shared pool共享池大小
  2. 使用10g的SGA自动管理内存ASMM方式可以一定程度上避免ORA-04031错误的发生,但是自动管理方式存在实际使用时存在一些缺点,建议在启用ASMM:SGA_Target的同时,设置 shared_pool_size和 db_cache_size的最小大小,以最大可能避免因resize造成的问题; 同时建议设置_enabled_shared_pool_duration=false,禁用shared pool duration特性,也可以一定程度上减少ORA-04031发生的概率。

_enabled_shared_pool_duration:该参数控制是否启用10g中特有的shared pool duration特性,当我们设置sga_target为0时该参数为false;同时在10.2.0.5前若cursor_space_for_time设置为true时该参数也为false,不过在10.2.0.5以后cursor_space_for_time参数被废弃

Slide:深入了解Oracle自动内存管理ASMM by Maclean Liu

PL/SQL Virtual Machine Memory Usage

PL/SQL Program Units即PL/SQL程序单元,常被叫做”library units”或lib-units.

参考以下模块类型:

  • package spec
  • package body
  • top-level function or procedure
  • type spec
  • type body
  • trigger
  • anonymous blocks.

PL/SQL 虚拟机的内存使用主要体现在4个方面:

  • PGA
    • PL/SQL stack call,用于保存本地变量和其他一些状态结构
    • NCOMP生成的动态链接库文件
  • CGA
    • 二级内存(secondary memory),分配的堆和大的可收缩本地变量如大的strings、Lob或collections
  • UGA
    • 程度单元的实例(library-unit instantiations),如package global variables, DL0/ DL1 dependency vectors, display frame等
  • SGA
    共享池中的MCODE子堆

KGL – Kernel Generic Library Manager
该layer管理会话间需要共享的资源,如PL/SQL MCODE,Diana,Source,SQL cursor,SQL Plan)

KGI – Kernel Generic Instantiation Layer.
该layer管理特定会话非共享的资源,如实例化的包含了包全局变量状态信息的PL/SQL程序单元

KOH/KGH 该layer用以管理heap service堆服务

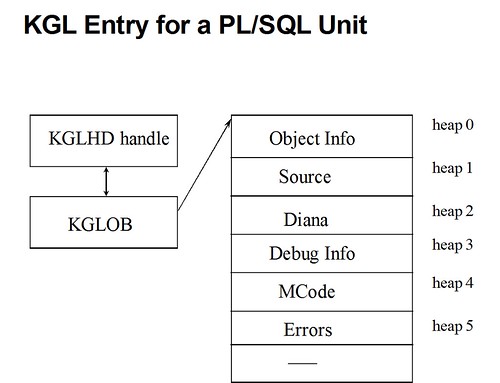
KGL_Entry_PLSQL_UNIT


PLSQL MCODE Heap的属性

  • machine dependent binary format for a compiled PL/SQL library-unit.
  • to execute code in a lib-unit, its MCODE heap must be loaded in memory.
  • MCODE is loaded in SGA and is “pinned” for CALL duration.
  • once unpinned, the heap may be aged; hence, may need to get re-loaded.
  • important to page large data structures in SGA.

MCODE Heap: Subcomponents

  • EntryPoint Piece (PL_UEP)
  • Code Segment or Byte Code Piece (PL_UCP)
  • Constant Pool:
    • Data Segment (PL_UKP)
    • Handle Segment (PL_UHS)
  • SQL Strings Table (PL_USP)

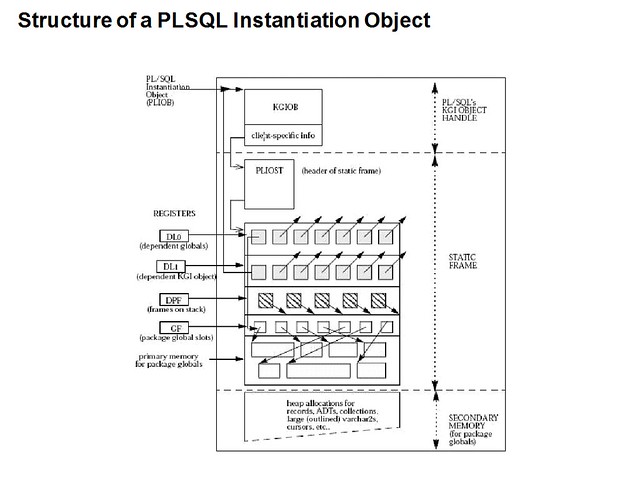
PL/SQL Instantiations

  • When a lib-unit is first referenced by a program (session) an instantiation of the lib unit is created.
  • PL/SQL relies on KGI for inst obj mgmt.
  • A PL/SQL lib-unit instantiation consists of:
    • PLIO struct (the handle of the PL/SQL inst obj)
    • Static Frame
    • Secondary (Heap) Memory for package globals
  • PLIO Struct
    • first portion of PLIO struct is the KGIOB struct (kgi’s portion of the object handle)
    • points to the static frame struct (PLIOST)
    • also contains other book-keeping info (such as memory duration of instantiation’s work area, etc.)
  • Static Frame:
    • represents that part of instantiation’s work area whose size is compile-time determined.
    • the root of the static frame is PLIOST struct which leads the following sub-pieces:
      • depends-on array to global variable vectors (DL0)
      • depends-on array to other instantiations (DL1)
      • Display Frame (DPF)
      • global variable vector for this unit (GF)
      • primary memory for global variables.
  • Secondary Memory for package globals
    • used to allocate data types that are stored out-of-line (heap allocated) e.g., collections, large strings, large records, LOBs, datetime types, etc.

Structure of a PLSQL Instantiation Object
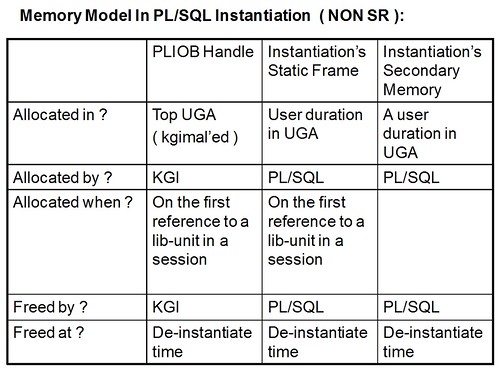
Memory Model In PLSQL Instantiation

SHMALL, SHMMAX and SGA sizing

Question:

I need to confirm my Linux kernel settings and also get pointers/explanation on how i need to properly setup my kernel for proper operation of the Oracle Server.
My aim for the SR is not so much to get actual answers on how to set values. Rather, I need help to clear up the concepts behind the numbers.

From the output of the commands below it can be seen that the server has 12 GB of memory and after the kernel is configured (see below output of ipcs -lms command), I have SHMMAX set at 8589933568.
After consulting various documents I have come to understand the following, please verify:

– The largest SGA size is that defined by PAGESIZE*kernel.shmall (in this case 16GB, which is a mistake apparently as the system only has 12GB of RAM)
– It is OK for shmmax to be smaller than the requested SGA. If additional size is needed, then the space will be allocated in multiple pages, as long as the size does not exceed PAGESIZE*kernel.shmall
– If more than one Oracle instances reside on the same server, then Linux Kernel settings will have to cater for the largest instance SGA, since
– … different instances will hold completely different memory segments, which will have to seperately adhere to kernel limitations, therefore the kernel limitations do not care for multiple instances, as those are different memory areas
– Memory for SGA is allocated completely by setting SGA_TARGET. In a different case, it will be allocated as needed

$ free
total used free shared buffers cached
Mem: 12299352 8217844 4081508 0 190816 6799828
-/+ buffers/cache: 1227200 11072152
Swap: 16775764 90912 16684852

ipcs -lms

—— Shared Memory Limits ——–
max number of segments = 4096
max seg size (kbytes) = 8388607
max total shared memory (kbytes) = 16777216
min seg size (bytes) = 1

—— Semaphore Limits ——–
max number of arrays = 128
max semaphores per array = 250
max semaphores system wide = 32000
max ops per semop call = 32000
semaphore max value = 32767

also ‘getconf PAGESIZE’ returns 4096

Answer:

– The largest SGA size is that defined by PAGESIZE*kernel.shmall (in this case 16GB, which is a mistake apparently as the system only has 12GB of RAM)

Comment :
Yes this needs to comply with the formula :
kernel.shmall = physical RAM size / pagesize as per NOTE:339510.1 .

– It is OK for shmmax to be smaller than the requested SGA. If additional size is needed, then the space will be allocated in multiple pages, as long as the size does not exceed PAGESIZE*kernel.shmall

Comment :
Yes it is ok to have SHMMAX<SGASIZE NOTE:567506.1 .
The allocation will be done in multiple shared segments either contigues
or non contiguous as per NOTE:15566.1

– If more than one Oracle instances reside on the same server, then Linux Kernel settings will have to cater for the largest instance SGA, since
different instances will hold completely different memory segments, which will have to seperately adhere to kernel limitations, therefore the kernel limitations do not care for multiple instances, as those are different memory areas.

Comment :
Yes thats valid for the SHMMAX , but for the SHMALL it is a systemwide
kernel variable affected by the physical memory and the pagesize .

– Memory for SGA is allocated completely by setting SGA_TARGET. In a different case, it will be allocated as needed.

comment :

Memory for the SGA is allocated completely by the SGA_MAX_SIZE .

I need to confirm my Linux kernel settings and also get pointers/explanation on how i need to properly setup my kernel for proper operation of the Oracle Server.
My aim for the SR is not so much to get actual answers on how to set values. Rather, I need help to clear up the concepts behind the numbers.

From the output of the commands below it can be seen that the server has 12 GB of memory and after the kernel is configured (see below output of ipcs -lms command), I have SHMMAX set at 8589933568.
After consulting various documents I have come to understand the following, please verify:

– The largest SGA size is that defined by PAGESIZE*kernel.shmall (in this case 16GB, which is a mistake apparently as the system only has 12GB of RAM)
– It is OK for shmmax to be smaller than the requested SGA. If additional size is needed, then the space will be allocated in multiple pages, as long as the size does not exceed PAGESIZE*kernel.shmall
– If more than one Oracle instances reside on the same server, then Linux Kernel settings will have to cater for the largest instance SGA, since
– … different instances will hold completely different memory segments, which will have to seperately adhere to kernel limitations, therefore the kernel limitations do not care for multiple instances, as those are different memory areas
– Memory for SGA is allocated completely by setting SGA_TARGET. In a different case, it will be allocated as needed

$ free
total used free shared buffers cached
Mem: 12299352 8217844 4081508 0 190816 6799828
-/+ buffers/cache: 1227200 11072152
Swap: 16775764 90912 16684852

ipcs -lms

—— Shared Memory Limits ——–
max number of segments = 4096
max seg size (kbytes) = 8388607
max total shared memory (kbytes) = 16777216
min seg size (bytes) = 1

—— Semaphore Limits ——–
max number of arrays = 128
max semaphores per array = 250
max semaphores system wide = 32000
max ops per semop call = 32000
semaphore max value = 32767

also ‘getconf PAGESIZE’ returns 4096


Large Memory Footprints on AIX

Connor Mcdonald-一位Oracle极客为我们分享了一个AIX平台上11g独享服务进程内存占用过量的问题,该问题最后被确认为Bug”11G SERVER PROCESSES CONSUMING MUCH MORE MEMORY THAT 10G OR 9I”,相关文档如下:


Memory Footprint For Dedicated Server Processes More Than Doubled After 11g Upgrade On AIX Platform [ID 1246995.1]

Bug 9796810: 11G SERVER PROCESSES CONSUMING MUCH MORE MEMORY THAT 10G OR 9I

Bug 10190759: PROCESSES CONSUMING ADDITIONAL MEMORY DUE TO ‘USLA HEAP’

可以看到上述问题仅发生在从9i/10g升级到11g后,作为一个已确认的升级Bug值得我们大家去关注;最近几年这样的升级会越来越多,同时希望该Bug能在11.2.0.3中修复。

实际上我在10.2.0.3上就遇到过类似的Process Large Footprints问题:用户在打上一个one-off patch[6110331]后单个server process的rss量明显上升,主机的内存使用量大幅提高,虽然这个问题同样提交了SR,但最后没有确认为Bug;用户试图询问Oracle GCS关于rss上升的原因,但语焉而不详。

Search Criteria:AIX 11.2

Memory Footprint For Dedicated Server Processes More Than Doubled After 11g Upgrade On AIX Platform (Doc ID 1246995.1)

1. Have you installed the patch 10190759 ?

Review the note:
Memory Footprint For Dedicated Server Processes More Than Doubled After 11g Upgrade On AIX Platform (Doc ID 1246995.1)

If you have not installed the patch ?
–>>there is one available for 11.2.0.2.0, 11.2.0.2.2, 11.2.0.2.3

If you need me to review the patches you have installed you can upload the opatch listing?

opatch lsinventory -patch -detail

2. If you have already installed the patch 10190759 then

The additional memory seen allocated to oracle processes in the 11.2 release is a consequence of the additional link options added to the oracle link
line, -bexpfull and -brtllib. The two link options were specifically added in 11.2.0.1 to support the online patching feature.
Patch Name or Number: 10190759


Changes in the make file have been implemented such that you can relink without these options (-bexpfull and -brtllib) to avoid
additional memory overhead incurred by adding these options.These changes are available via a one-off patch.

This is a known bug: BUG:10190759 – PROCESSES CONSUMING ADDITIONAL MEMORY DUE TO ‘USLA HEAP’

Install  Patch: 10190759

How GoldenGate process consumes memory

Question:
We are using Golden Gate to replicate the data from Oracle 9.2.0.8 on Solaris8 SPARC 64 bit (GoldenGate Version 10.4.0.31 Build 001) to Oracle RAC 11.2.0.1 on Solaris10 SPARC 64bit (GoldenGate Version 10.4.0.19 Build 002). Both GoldenGate Extract and Replicat process are working fine. Please refer below information for more easy to understand our goldengate setup.

Extract Side | Replicat Side
Hostname: HK8SN020 | Hostname: HK8SP226 (HK8SP227 dont have any goldengate client, all goldengate process are located on HK8SP226)
Oracle 9.2.0.8 (32bit binary) | Oracle 11.2.0.1 (64bit binary)
Solaris8 Sparc 64bit Kernel | Solaris10 Sparc 64bit kernel
GoldenGate Version 10.4.0.31 Build 001 | GoldenGate Version 10.4.0.19 Build 002

However, on 27-Mar-2010, we found the server memory utilization on Solaris10 HK8SP226 are unexpected continuously rising since around 01:30. At around 3:20, the server memory utilization are up to 100%. At around 5:20, the server memory utilization is suddenly drop and back to normal. We compared the “Sar -r” and Solaris server message logfile. We found that on 05:21:44, goldengate relicate process are terminated with error message ” malloc 2097152 bytes failed”. After that, seem the server memory are suddenly released and back to normal memory utilization level.
We suspected the abnormal server memory usage are cased by goldengate replicate process. Can you please help to investigate and find out the root cause?

Answer:
GoldenGate replicates only committed transactions, it stores the operations of each transaction in a managed virtual-memory pool known as a cache until it receives either a commit or a rollback for that transaction. One global cache operates as a shared resource of an Extract process. The following sub-pools of virtual memory are allocated from the global cache:(1)One sub-pool per log reader thread for most transaction row data. and (2)One sub-pool for BLOB data and possibly other large items.

Within each sub-pool, individual buffers are allocated from the global cache, each one containing information that is relative to a transaction that is being processed by GoldenGate. The sizes of the initial and incremental buffers are controlled by the CACHEBUFFERSIZE option of CACHEMGR.

The actual amount of physical memory that is used by any GoldenGate process is controlled by the operating system, not the GoldenGate process. The global cache size is controlled by the CACHESIZE option of CACHEMGR.Cache manager keeps a GoldenGate process working within the soft limit of its global cache size, only allocating virtual memory (not physical memory) on demand. The actual amount of physical memory that is used by any GoldenGate process is controlled by the operating system, not the GoldenGate program.

GoldenGate cache manager only takes advantage of the memory management functions of the operating system to ensure that GoldenGate processes work in a sustained and efficient manner. Within cache, OGG makes use of all the modern “virtual memory” techniques by allocating and managing active buffers efficiently and recycling old buffers instead of paging to disk, when possible and paging less-used information to disk, when necessary.

When COM initializes, by default it first determines how much virtual memory the OS has available for it and uses that to determine what CACHESIZE should be. Default for CACHESIZE is 8GB for 64-bit systems and 2GB for 32-bit systems.

The available virtual memory is reported with the PROCESS VM AVAIL FROM OS value in the report file. The CACHESIZE value will either be rejected or sized down if it is larger than, or sufficiently close to, the amount of virtual memory that is available to the process.

The CACHESIZE value will always be a power of two, rounded down from the value of PROCESS VM AVAIL FROM OS, unless the latter is itself a power of two, in which case it is halved. After the specified size is consumed by data, the memory manager will try to free up memory by paging data to disk or by reusing aged buffers, before requesting more memory from the system.

The memory manager generates statistics that can be viewed with the SEND EXTRACT or SEND REPLICAT command when used with the CACHEMANAGER option.The statistics show the size of the memory pool, the paging frequency, the size of the transactions, and other information that creates a system profile. Based on this profile, you might need to make adjustments to the memory cache if you see performance problems that appear to be related to file caching. The first step is to modify the CACHESIZE and CACHEPAGEOUTSIZE parameters. You might need to use a higher or lower cache size, a higher or lower page size, or a combination of both, based on the size and type of transactions that are being generated. You might also need to adjust the initial memory allocation with the CACHEBUFFERSIZE option. It is possible, however, that operating system constraints could limit the effect of modifying any components of the CACHEMGR parameter. In particular, if the operating system has a small per-process virtual memory limit, it will force more file caching, regardless of the CACHEMGR configuration.

Once the CACHESIZE is set to 1 GB, the GoldenGate process will use up to 1 GB virtual memory and then it will use swap space on disk.
If the CACHESIZE is explicitly set in process parameter file then the CACHEMGR will use only 1GB. Otherwise it will default to the Memory size depending upon the platform(32 or 64).If a fixed CACHESIZE is set in the parameter file then it will be taken by the process, if no the default will be taken by the process depending upon the platform. If very low virtual memory limit is set or available in the OS then it will force more file caching. There is always a difference between caching in memory buffers and file caching as it involves read and write i/o’s.

So try to set a default CACHESIZE for the GoldenGate Process (Extract/Replicat). Edit the respective source extract and target replicat parameter files and use the below mentioned CACHEMGR parameter with the options given and restart the processes.

CACHEMGR CACHEBUFFERSIZE 64KB, CACHESIZE 1GB, CACHEDIRECTORY
, CACHEDIRECTORY
Example:
CACHEMGR CACHEBUFFERSIZE 64KB, CACHESIZE 1GB, CACHEDIRECTORY /ggs/dirtmp, CACHEDIRECTORY /ggs2/temp

So once the CACHESIZE is set to 1 GB, the GoldenGate process will use up to 1 GB virtual memory only and then after it will use swap space on disk.

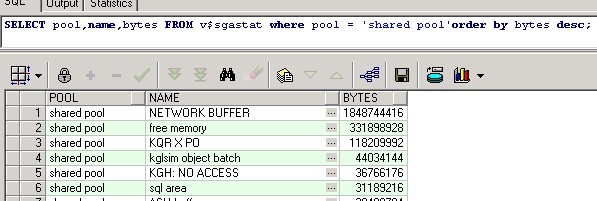
共享池中的NETWORK BUFFER

中午休闲时在itpub看到一个关于network buffer占用大量内存的求助帖,帖子原文如下:

各位大侠们,请教个问题。昨天遇到一个solaris10平台下的oracle10g(10.2.0.4)数据库报共享内存不足,发现数据库的sga_target才2512M,而在v$sgastat视图中查到的
shared pool–>NETWORK BUFFER就有1848744416字节,是什么引起network buffer这么大呢,在udmp目录下1分钟产生几个跟 ORA-4031相关的文件。

==================
SQL> show parameter sga

NAME                                 TYPE        VALUE
———————————— ———– ——————————
lock_sga                             boolean     FALSE
pre_page_sga                         boolean     FALSE
sga_max_size                         big integer 2512M
sga_target                           big integer 2512M
SQL> show parameter share

NAME                                 TYPE        VALUE
———————————— ———– ——————————
hi_shared_memory_address             integer     0
max_shared_servers                   integer
shared_memory_address                integer     0
shared_pool_reserved_size            big integer 72142028
shared_pool_size                     big integer 0
shared_server_sessions               integer
shared_servers                       inte


NETWORK BUFFER对我们来说或许有些陌生,那是因为绝大多数场合都采用dedicated server模式,共享服务器模式下NETWORK BUFFER将被大量使用。MOS文档[741523.1]叙述了NETWORK BUFFER的主要用途:

On 10.2, after upgrading from 9iR2, the following error occurs:

ORA-07445: exception encountered: core dump [] [] [] [] [] []

plus

Dispatcher Trace file contains an ORA-4031 Diagnostic trace, with:
Allocation request for: NETWORK BUFFER

…followed by…

found dead dispatcher ‘D000’, pid = (12, 1)

The amount of memory used by NETWORK BUFFERs in the shared pool has significantly grown between 9.2 and 10.2.  The side-effect is to run-out of Shared Pool memory (reporting an ORA-4031), when a large number of sessions are connecting to the server (in the order of 1000’s).

While a session is being established, we allocate 3 buffers each of 32k in size.  After the session is established, we use the 3 SDU-sized buffers, however we do not deallocate the 3x32k buffer we allocated initially.

This issue has been logged in unpublished Bug 5410481.

Additionally, there is  Bug 6907529.

NS buffers are allocated based on the SDU specified by the user. The negotiated SDU could be considerably lower. The difference between these two is wasted.

For example, the dispatcher specifies an SDU of 32k. Clients, by default, use an SDU of 8k. The remaining 24k is never used.

Issue in Bug 6907529 is fixed in 11.2.

Bug 5410481 is fixed in 10.2.0.3.

As a workaround to 5410481, the ADDRESS part of DISPATCHERS parameter can be used to specify a smaller SDU size.

For example:
DISPATCHERS=”(DESCRIPTION=(ADDRESS=(PROTOCOL=tcp))(SDU=8192))”

To implement the change;

  1. connect to the database as SYSDBA
  2. alter system set dispatchers='(address=(protocol=tcp)(host=IP-Address)(sdu=8192))(dispatchers=DispatcherCount)’ scope=spfile;
  • re-start the database
  • 你可能会问SDU是什么?Oracle NET缓存的数据以SDU为基本单位,SDU即 session data unit,一般默认为8192 bytes。当这些数据单元被写满,或被client读取时,他们将被传递给Oracle Network层(oracle network layer)。譬如Data Guard环境中redo传输的每个Chunk往往要大于8192 bytes,那么默认的SDU就不太适用。当有大量重做数据要传输到standby库时,增大SDU buffer的大小可以改善Oracle的网络性能。你可以很方便的通过修改sqlnet.ora配置文件来修改SDU,如在该文件内加入以下条目:
    DEFAULT_SDU_SIZE=32767 /*修改全局默认SDU到32k*/
    当然你也可以在tnsnames.ora中定义服务别名时个别指定SDU,下文我们会用到。
    如上文所述在版本10.2.0.3以前当会话建立时,Oracle会以dispatchers参数定义的SDU为单位,分配3个单位的NETWORK  BUFFER,而实际上client端可能并未指定和dispatchers一致的SDU,若dispatchers中定义的SDU为32k,而client使用默认的8k SDU,则一个会话可能要浪费3*32-3*8=72k的NETWORK BUFFER。

    为什么共享服务器模式下会用到共享池中的NETWORK BUFFER,而独享服务器模式下没有呢?因为在独享服务器模式下每个会话所分配的三个SDU是从PGA中获取的;当使用共享服务器模式时会话与服务进程形成一对多的映射关系,这三个SDU 的NETWORK BUFFER同UGA一样转移到了SGA中。

    下面我们通过实践来进一步验证。

    SQL> select * from v$version;
    
    BANNER
    ----------------------------------------------------------------
    Oracle Database 10g Enterprise Edition Release 10.2.0.4.0 - 64bi
    PL/SQL Release 10.2.0.4.0 - Production
    CORE    10.2.0.4.0      Production
    TNS for Linux: Version 10.2.0.4.0 - Production
    NLSRTL Version 10.2.0.4.0 - Production
    /*实验服务器端采用10.2.0.4版本*/
    SQL> show parameter dispatch
    
    NAME                                 TYPE        VALUE
    ------------------------------------ ----------- ------------------------------
    dispatchers                          string      (address=(protocol=tcp)(host=1
                                                            92.168.1.103)(sdu=32768))(SERV
                                                            ICE=cXDB)(dispatchers=10)
    /*dispatchers中指定了SDU为32k*/
    
    C:\Windows\System32>tnsping cXDB
    TNS Ping Utility for 32-bit Windows: Version 11.2.0.1.0 - Production on 05-8月 -2010 22:51:27
    Copyright (c) 1997, 2010, Oracle.  All rights reserved.
    已使用的参数文件:
    D:\tools\adminstratorg\orahome\network\admin\sqlnet.ora
    已使用 TNSNAMES 适配器来解析别名
    尝试连接 (DESCRIPTION = (SDU=8192) (ADDRESS_LIST = (ADDRESS = (PROTOCOL = TCP)(HOST = 192.168.1.103)(PORT = 1521))) (CONNECT_DATA = (SERVER = SHARED) (SERVICE_NAME = cXDB)))
    OK (30 毫秒)
    /* client端采用11.2.0.1版本,定义了共享服务器模式的服务别名,显式指定SDU为8192字节*/
    

    这里我们要用到一个简单的java程序,用来模拟大量会话登录;这个程序很傻瓜,但是总比你一个个开SQLPLUS要明智的多:

    /*这是一个很简单的java程序,登录远程数据库,并尝试打开600个回话,并且都指定了SDU为8192*/
    package javaapplication2;
    import oracle.jdbc.*;
    import java.sql.*;
    public class Main
    {
        public static void main(String[] args) throws SQLException
        {
            try
            {
                Class.forName("oracle.jdbc.driver.OracleDriver");
            }
            catch(Exception e )
            {
            }
            Connection cnn1=DriverManager.getConnection("jdbc:oracle:thin:@(DESCRIPTION = (SDU=8192) (ADDRESS_LIST = (ADDRESS = (PROTOCOL = TCP)(HOST = 192.168.1.103)(PORT = 1521))) (CONNECT_DATA = (SERVER = SHARED) (SERVICE_NAME = cXDB)))", "system", "password");
            Statement stat1=cnn1.createStatement();
            ResultSet rst1=stat1.executeQuery("select * from v$version");
            while(rst1.next())
            {
                System.out.println(rst1.getString(1));
            }
            Connection m[]=new Connection[2000];
            Statement s[]=new Statement[2000];
            ResultSet r[]=new ResultSet[2000];
            int i=0;
            while(i<600)
            {
                try
                {
                    m[i]=DriverManager.getConnection("jdbc:oracle:thin:@(DESCRIPTION = (SDU=8192) (ADDRESS_LIST = (ADDRESS = (PROTOCOL = TCP)(HOST = 192.168.1.103)(PORT = 1521))) (CONNECT_DATA = (SERVER = SHARED) (SERVICE_NAME = cXDB)))", "system", "password");
                }
                catch (Exception em)
                {
                    System.out.println(em.getMessage());
                }
                try
                {
                    Thread.sleep(3);
                }
                catch (Exception e)
                {
                }
                s[i]=m[i].createStatement();
                m[i].setAutoCommit(false);
                i++;
                System.out.println(i+"is ok !");
            }
            System.out.println("We are waiting!");
            try
            {
                Thread.sleep(1000);
            }
            catch (Exception e)
            {
            }
        }
    }
    

    编译上面这段程序,尝试执行看看,执行的同时留意观察NETWORK BUFFER:

    SQL> select name,pool,bytes from v$sgastat where name like '%NETWORK%';
    
    NAME                       POOL              BYTES
    -------------------------- ------------ ----------
    NETWORK BUFFER             shared pool      328080
    
    java -jar ora_network_buffer_test_8.jar
    /*启动编译后的测试程序*/
    
    SQL> select name,pool,bytes from v$sgastat where name like '%NETWORK%';
    NAME                       POOL              BYTES
    -------------------------- ------------ ----------
    NETWORK BUFFER             shared pool    69608200
    
    SQL> select name,pool,bytes from v$sgastat where name like '%NETWORK%';
    NAME                       POOL              BYTES
    -------------------------- ------------ ----------
    NETWORK BUFFER             shared pool      348960
    /*会话终止后,NETWORK BUFFER回缩*/
    
    修改上述程序中的SDU到32k,重新编译后再次测试
    java -jar ora_network_buffer_test_32.jar
    
    SQL> select name,pool,bytes from v$sgastat where name like '%NETWORK%';
    
    NAME                       POOL              BYTES
    -------------------------- ------------ ----------
    NETWORK BUFFER             shared pool      328080
    
    SQL> select name,pool,bytes from v$sgastat where name like '%NETWORK%';
    
    NAME                       POOL              BYTES
    -------------------------- ------------ ----------
    NETWORK BUFFER             shared pool    99148576
    /*可以看到同样的会话数量,client端SDU增大到32k后,NETWORK BUFFER有了大幅增长*/
    
    我们修改dispatchers参数中的SDU到8k看看
    SQL> alter system set dispatchers='';
    
    System altered.
    
    SQL> alter system set dispatchers='(address=(protocol=tcp)(host=192.168.1.103)(sdu=8192))(SERVICE=cXDB)(dispatchers=10)';
    
    System altered.
    SQL> show parameter dispatchers
    
    NAME                                 TYPE        VALUE
    ------------------------------------ ----------- ------------------------------
    dispatchers                          string      (address=(protocol=tcp)(host=1
                                                            92.168.1.103)(sdu=8192))(SERVI
                                                            CE=cXDB)(dispatchers=10)
    SQL> select name,pool,bytes from v$sgastat where name like '%NETWORK%';
    
    NAME                       POOL              BYTES
    -------------------------- ------------ ----------
    NETWORK BUFFER             shared pool      328080
    
    java -jar ora_network_buffer_test_32.jar
    
    SQL> select name,pool,bytes from v$sgastat where name like '%NETWORK%';
    
    NAME                       POOL              BYTES
    -------------------------- ------------ ----------
    NETWORK BUFFER             shared pool    99148552
    /*看起来dispatcher中的SDU优先级并没有client中的高*/
    我们再来看看client中SDU为8k的情况
    SQL> show parameter dispatchers
    
    NAME                                 TYPE        VALUE
    ------------------------------------ ----------- ------------------------------
    dispatchers                          string      (address=(protocol=tcp)(host=1
                                                            92.168.1.103)(sdu=8192))(SERVI
                                                            CE=cXDB)(dispatchers=10)
    SQL> select name,pool,bytes from v$sgastat where name like '%NETWORK%';
    
    NAME                       POOL              BYTES
    -------------------------- ------------ ----------
    NETWORK BUFFER             shared pool      328080
    
    java -jar ora_network_buffer_test_8.jar
    
    SQL> select name,pool,bytes from v$sgastat where name like '%NETWORK%';
    NAME                       POOL              BYTES
    -------------------------- ------------ ----------
    NETWORK BUFFER             shared pool    69608200
    /*与dispatchers中为32k,而client为8k时一样*/
    

    由以上实践可知10.2.0.4之后,NETWORK BUFFER的使用量由客户端设定的SDU和共享服务器会话数决定。我在之前的博文中曾经列出过TNS协议的几个基础类描述(见《Oracle 网络TNS协议的几个基础类描述》),其中Session包含了setSDU(int i)方法,其代码如下:

    public void setSDU(int i)
    {
    if(i <= 0) sdu = 2048;
    else if(i > 32767)
    sdu = 32767;
    else if(i < 512)
    sdu = 512;
    else
    sdu = i;
    }
    

    由以上代码可知,客户端设定的SDU时,其最大最小值分别为32k和512bytes,大于32k时被强制设为32k,而小于512bytes时被强制设为512bytes,若设定SDU<0,则被强制修正为2048 bytes,在512 bytes- 32767 bytes之间则为原值不变。

    理解Oracle在AIX平台上的内存使用

    1.理解Oracle进程

    首先我们要做的是理解Oracle的3种进程类型:后台进程( background process)和服务进程(也叫前台进程)还有用户进程。当我们尝试启动Oracle实例,首先受到召唤的是后台进程,一组后台进程和内存组建构成了 Oracle 实例,这些后台进程包括 日志记录进程lgwr,数据库写出进程 dbwr, 系统监控进程smon, 进程监控进程pmon, 分布式恢复进程reco, 检查点进程ckpt, 11g后变得更多了,多到我记不住。 这些进程在UNIX上的具体args总是形如ora_functionname_sid, 这里的functionname即后台进程的功能名而sid 即 $ORACLE_SID所指出的值。

    第二类是用户进程,它可能是一个sqlplus命令行,可能是imp/exp工具,也可能是用户开发的一个java程序,当用户进程在本地启动时它们不直接操作SGA或者PGA,但毫无疑问它们也是需要消耗一定数量的虚拟内存的。
    第三类进程就是我们说的服务进程,启动一个sqlplus 连接(这个连接可能是连到本地的 也可能的是远程的,这在我们讨论内存使用时无关紧要)的同时我们需要用到一个服务进程,它直接向我们的sqlplus终端负责。我们有时候也称服务进程为影子进程。影子进程总是和每一个用户进程一一对应的映射除非我们用到了MTS(多线程服务器)时。影子进程一般形如oracleSID,这里的sid和前文所指一般。


    2.理解Oracle的内存使用

    Oracle对内存的使用可以划分为2个大类型,即私有的和共享的。私有内存仅供单个进程使用。相反的,共享内存可以供多个进程使用且在具体使用上要复杂得多。在合计共享内存时,我们只需将所有进程所共享的内存段累加一次即可(Oracle 的SGA具体反映到OS层可能是多个shared memory segment,我们只需要将这一个或多个段的大小加到一起就可以了)。

    我们可能使用到的最大的共享内存段毫无疑问会是SGA(SYSTEM GLOBAL AREA),我们看到的SGA被映射成虚拟地址且被每一个后台进程和前台进程attach到自己身上,以便随时能够利用到SGA; 我们有很多性能工具可以反映这部分的内存使用, 好比’top’,’ps -lf’, 但他们都无法分辨前后台进程内存使用中私有内存和共享内存分别得使用状况(我们往往只能得到一个Oracle使用内存很多的结论,却不知道是PGA还是 SGA消耗的更多的内存)。如果我们把从这些途径中获得每个进程的内存使用量相加,我们会发现这样计算的总内存使用量是SGA+PGA的几十倍,这是违反常识的,实际也分配不到那么多内存。 要真正了解Oracle内存使用,你使用的内存窥测命令需要能够分离Oracle使用的私有内存和共享内存。在Aix平台上有这样一个svmon(在其他 UNIX平台上有一个我认为更好的工具是pmap,与之对应AIX上有一个procmap命令,但这个命令并不能窥测Oracle 私有或共享内存的使用,所以我们只能退而求其次了)。


    您可能在AIX的安装光盘上通过安装文件(filesets) “perfagent.tools”来获取该工具。使用”smit install_lastest”命令可以配备这个命令。对于svmon,作为一个非AIX操作系统专家而言,我推荐您读一下我引用的这篇文档:


    The svmon Command

    The svmon command provides a more in-depth analysis of memory usage. It is more informative, but also more intrusive, than the vmstat and ps commands. The svmon command captures a snapshot of the current state of memory. However, it is not a true snapshot because it runs at the user level with interrupts enabled.

    To determine whether svmon is installed and available, run the following command:

    # lslpp -lI perfagent.tools
    
    The svmon command can only be executed by the root user.
    
    If an interval is used (-i option), statistics will be displayed until the command is killed or until the number of intervals, which can be specified right after the interval, is reached.
    
    You can use four different reports to analyze the displayed information:
    
    Global (-G)
    Displays statistics describing the real memory and paging space in use for the whole system.
    
    Process (-P)
    Displays memory usage statistics for active processes.
    
    Segment (-S)
    Displays memory usage for a specified number of segments or the top ten highest memory-usage processes in descending order.
    
    Detailed Segment (-D)
    Displays detailed information on specified segments.
    
    Additional reports are available in AIX 4.3.3 and later, as follows:
    
    User (-U)
    Displays memory usage statistics for the specified login names. If no list of login names is supplied, memory usage statistics display all defined login names.
    
    Command (-C)
    Displays memory usage statistics for the processes specified by command name.
    
    Workload Management Class (-W)
    Displays memory usage statistics for the specified workload management classes. If no classes are supplied, memory usage statistics display all defined classes.
    
    To support 64-bit applications, the output format of the svmon command was modified in AIX 4.3.3 and later.
    
    Additional reports are available in operating system versions later than 4.3.3, as follows:
    
    Frame (-F)
    Displays information about frames. When no frame number is specified, the percentage of used memory is reported. When a frame number is specified, information about that frame is reported.
    
    Tier (-T)
    Displays information about tiers, such as the tier number, the superclass name when the -a flag is used, and the total number of pages in real memory from segments belonging to the tier.


    How Much Memory is in Use

    To print out global statistics, use the -G flag. In this example, we will repeat it five times at two-second intervals.


    # svmon -G -i 2 5
    memory   inuse  pinpgspace
    size inuse free pin work pers clnt work pers clnt size inuse
    16384 16250 134 2006 10675 2939 2636 2006 0 0 40960 12674
    16384 16254 130 2006 10679 2939 2636 2006 0 0 40960 12676
    16384 16254 130 2006 10679 2939 2636 2006 0 0 40960 12676
    16384 16254 130 2006 10679 2939 2636 2006 0 0 40960 12676
    16384 16254 130 2006 10679 2939 2636 2006 0 0 40960 12676
    
    The columns on the resulting svmon report are described as follows:
    
    memory
    Statistics describing the use of real memory, shown in 4 K pages.
    
    size
    Total size of memory in 4 K pages.
    
    inuse
    Number of pages in RAM that are in use by a process plus the number of persistent pages that belonged to a terminated process and are still resident in RAM. This value is the total size of memory minus the number of pages on the free list.
    
    free
    Number of pages on the free list.
    
    pin
    Number of pages pinned in RAM (a pinned page is a page that is always resident in RAM and cannot be paged out).
    
    in use
    Detailed statistics on the subset of real memory in use, shown in 4 K frames.
    
    work
    Number of working pages in RAM.
    
    pers
    Number of persistent pages in RAM.
    
    clnt
    Number of client pages in RAM (client page is a remote file page).
    
    pin
    Detailed statistics on the subset of real memory containing pinned pages, shown in 4 K frames.
    
    work
    Number of working pages pinned in RAM.
    
    pers
    Number of persistent pages pinned in RAM.
    
    clnt
    Number of client pages pinned in RAM.
    
    pg space
    Statistics describing the use of paging space, shown in 4 K pages. This data is reported only if the -r flag is not used. The value reported starting with AIX 4.3.2 is the actual number of paging-space pages used (which indicates that these pages were paged out to the paging space). This differs from the vmstat command in that vmstat's avm column which shows the virtual memory accessed but not necessarily paged out.
    
    size
    Total size of paging space in 4 K pages.
    
    inuse
    Total number of allocated pages.
    
    In our example, there are 16384 pages of total size of memory. Multiply this number by 4096 to see the total real memory size (64 MB). While 16250 pages are in use, there are 134 pages on the free list and 2006 pages are pinned in RAM. Of the total pages in use, there are 10675 working pages in RAM, 2939 persistent pages in RAM, and 2636 client pages in RAM. The sum of these three parts is equal to the inuse column of the memory part. The pin part divides the pinned memory size into working, persistent and client categories. The sum of them is equal to the pin column of the memory part. There are 40960 pages (160 MB) of total paging space, and 12676 pages are in use. The inuse column of memory is usually greater than the inuse column of pg spage because memory for file pages is not freed when a program completes, while paging-space allocation is.
    
    In AIX 4.3.3 and later, systems the output of the same command looks similar to the following:
    
    # svmon -G -i 2 5
    
    size inuse free pin virtual
    memory 65527 64087 1440 5909 81136
    pg space 131072 55824
    
    work pers clnt
    pin 5918 0 0
    in use 47554 13838 2695
    
    size inuse free pin virtual
    memory 65527 64091 1436 5909 81137
    pg space 131072 55824
    
    work pers clnt
    pin 5918 0 0
    in use 47558 13838 2695
    
    size inuse free pin virtual
    memory 65527 64091 1436 5909 81137
    pg space 131072 55824
    
    work pers clnt
    pin 5918 0 0
    in use 47558 13838 2695
    
    size inuse free pin virtual
    memory 65527 64090 1437 5909 81137
    pg space 131072 55824
    
    work pers clnt
    pin 5918 0 0
    in use 47558 13837 2695
    
    size inuse free pin virtual
    memory 65527 64168 1359 5912 81206
    pg space 131072 55824
    
    work pers clnt
    pin 5921 0 0
    in use 47636 13837 2695
    
    The additional output field is the virtual field, which shows the number of pages allocated in the system virtual space.
    
    Who is Using Memory?
    
    The following command displays the memory usage statistics for the top ten processes. If you do not specify a number, it will display all the processes currently running in this system.
    
    # svmon -Pau 10
    
    Pid Command Inuse Pin Pgspace
    15012 maker4X.exe 4783 1174 4781
    2750 X 4353 1178 5544
    15706 dtwm 3257 1174 4003
    17172 dtsession 2986 1174 3827
    21150 dtterm 2941 1174 3697
    17764 aixterm 2862 1174 3644
    2910 dtterm 2813 1174 3705
    19334 dtterm 2813 1174 3704
    13664 dtterm 2804 1174 3706
    17520 aixterm 2801 1174 3619
    
    Pid: 15012
    Command: maker4X.exe
    
    Segid Type Description Inuse Pin Pgspace Address Range
    1572 pers /dev/hd3:62 0 0 0 0..-1
    142 pers /dev/hd3:51 0 0 0 0..-1
    1bde pers /dev/hd3:50 0 0 0 0..-1
    2c1 pers /dev/hd3:49 1 0 0 0..7
    9ab pers /dev/hd2:53289 1 0 0 0..0
    404 work kernel extension 27 27 0 0..24580
    1d9b work lib data 39 0 23 0..607
    909 work shared library text 864 0 7 0..65535
    5a3 work sreg[4] 9 0 12 0..32768
    1096 work sreg[3] 32 0 32 0..32783
    1b9d work private 1057 1 1219 0..1306 : 65307..65535
    1af8 clnt 961 0 0 0..1716
    0 work kernel 1792 1146 3488 0..32767 : 32768..65535
    ...


    The output is divided into summary and detail sections. The summary section lists the top ten highest memory-usage processes in descending order.

    Pid 15012 is the process ID that has the highest memory usage. The Command indicates the command name, in this case maker4X.exe. The Inuse column (total number of pages in real memory from segments that are used by the process) shows 4783 pages (each page is 4 KB). The Pin column (total number of pages pinned from segments that are used by the process) shows 1174 pages. The Pgspace column (total number of paging-space pages that are used by the process) shows 4781 pages.

    The detailed section displays information about each segment for each process that is shown in the summary section. This includes the segment ID, the type of the segment, description (a textual description of the segment, including the volume name and i-node of the file for persistent segments), number of pages in RAM, number of pinned pages in RAM, number of pages in paging space, and address range.

    The Address Range specifies one range for a persistent or client segment and two ranges for a working segment. The range for a persistent or a client segment takes the form ‘0..x,’ where x is the maximum number of virtual pages that have been used. The range field for a working segment can be ‘0..x : y..65535’, where 0..x contains global data and grows upward, and y..65535 contains stack area and grows downward. For the address range, in a working segment, space is allocated starting from both ends and working towards the middle. If the working segment is non-private (kernel or shared library), space is allocated differently. In this example, the segment ID 1b9d is a private working segment; its address range is 0..1306 : 65307..65535. The segment ID 909 is a shared library text working segment; its address range is 0..65535.

    A segment can be used by multiple processes. Each page in real memory from such a segment is accounted for in the Inuse field for each process using that segment. Thus, the total for Inuse may exceed the total number of pages in real memory. The same is true for the Pgspace and Pin fields. The sum of Inuse, Pin, and Pgspace of all segments of a process is equal to the numbers in the summary section.

    You can use one of the following commands to display the file name associated with the i-node:


    * ncheck -i i-node_number volume_name
    * find file_system_associated_with_lv_name -xdev -inum inode_number -print
    
    To get a similar output in AIX 4.3.3 and later, use the following command:
    
    # svmon -Put 10
    
    ------------------------------------------------------------------------------
    Pid Command Inuse Pin Pgsp Virtual 64-bit Mthrd
    2164 X 15535 1461 34577 37869 N N
    
    Vsid Esid Type Description Inuse Pin Pgsp Virtual Addr Range
    1966 2 work process private 9984 4 31892 32234 0..32272 :
    65309..65535
    4411 d work shared library text 3165 0 1264 1315 0..65535
    0 0 work kernel seg 2044 1455 1370 4170 0..32767 :
    65475..65535
    396e 1 pers code,/dev/hd2:18950 200 0 - - 0..706
    2ca3 - work 32 0 0 32 0..32783
    43d5 - work 31 0 6 32 0..32783
    2661 - work 29 0 0 29 0..32783
    681f - work 29 0 25 29 0..32783
    356d f work shared library data 18 0 18 24 0..310
    34e8 3 work shmat/mmap 2 2 2 4 0..32767
    5c97 - pers /dev/hd4:2 1 0 - - 0..0
    5575 - pers /dev/hd2:19315 0 0 - - 0..0
    4972 - pers /dev/hd2:19316 0 0 - - 0..5
    4170 - pers /dev/hd3:28 0 0 - - 0..0
    755d - pers /dev/hd9var:94 0 0 - - 0..0
    6158 - pers /dev/hd9var:90 0 0 - - 0..0
    
    ------------------------------------------------------------------------------
    Pid Command Inuse Pin Pgsp Virtual 64-bit Mthrd
    25336 austin.ibm. 12466 1456 2797 11638 N N
    
    Vsid Esid Type Description Inuse Pin Pgsp Virtual Addr Range
    14c3 2 work process private 5644 1 161 5993 0..6550 :
    65293..65535
    4411 d work shared library text 3165 0 1264 1315 0..65535
    0 0 work kernel seg 2044 1455 1370 4170 0..32767 :
    65475..65535
    13c5 1 clnt code 735 0 - - 0..4424
    d21 - pers /dev/andy:563 603 0 - - 0..618
    9e6 f work shared library data 190 0 2 128 0..3303
    942 - pers /dev/cache:16 43 0 - - 0..42
    2ca3 - work 32 0 0 32 0..32783
    49f0 - clnt 10 0 - - 0..471
    1b07 - pers /dev/andy:8568 0 0 - - 0..0
    623 - pers /dev/hd2:22539 0 0 - - 0..1
    2de9 - clnt 0 0 - - 0..0
    1541 5 mmap mapped to sid 761b 0 0 - -
    5d15 - pers /dev/andy:487 0 0 - - 0..3
    4513 - pers /dev/andy:486 0 0 - - 0..45
    cc4 4 mmap mapped to sid 803 0 0 - -
    242a - pers /dev/andy:485 0 0 - - 0..0
    ...
    
    The Vsid column is the virtual segment ID, and the Esid column is the effective segment ID. The effective segment ID reflects the segment register that is used to access the corresponding pages.
    
    Detailed Information on a Specific Segment ID
    
    The -D option displays detailed memory-usage statistics for segments.
    
    # svmon -D 404
    Segid: 404
    Type: working
    Description: kernel extension
    Address Range: 0..24580
    Size of page space allocation: 0 pages ( 0.0 Mb)
    Inuse: 28 frames ( 0.1 Mb)
    Page Frame Pin Ref Mod
    12294 3320 pin ref mod
    24580 1052 pin ref mod
    12293 52774 pin ref mod
    24579 20109 pin ref mod
    12292 19494 pin ref mod
    12291 52108 pin ref mod
    24578 50685 pin ref mod
    12290 51024 pin ref mod
    24577 1598 pin ref mod
    12289 35007 pin ref mod
    24576 204 pin ref mod
    12288 206 pin ref mod
    4112 53007 pin mod
    4111 53006 pin mod
    4110 53005 pin mod
    4109 53004 pin mod
    4108 53003 pin mod
    4107 53002 pin mod
    4106 53001 pin mod
    4105 53000 pin mod
    4104 52999 pin mod
    4103 52998 pin mod
    4102 52997 pin mod
    4101 52996 pin mod
    4100 52995 pin mod
    4099 52994 pin mod
    4098 52993 pin mod
    4097 52992 pin ref mod
    
    The detail columns are explained as follows:
    
    Page
    Specifies the index of the page within the segment.
    
    Frame
    Specifies the index of the real memory frame that the page resides in.
    
    Pin
    Specifies a flag indicating whether the page is pinned.
    
    Ref
    Specifies a flag indicating whether the page's reference bit is on.
    
    Mod
    Specifies a flag indicating whether the page is modified.
    
    The size of page space allocation is 0 because all the pages are pinned in real memory.
    
    An example output from AIX 4.3.3 and later, is very similar to the following:
    
    # svmon -D 629 -b
    
    Segid: 629
    Type: working
    Address Range: 0..77
    Size of page space allocation: 7 pages ( 0.0 Mb)
    Virtual: 11 frames ( 0.0 Mb)
    Inuse: 7 frames ( 0.0 Mb)
    
    Page Frame Pin Ref Mod
    0 32304 N Y Y
    3 32167 N Y Y
    7 32321 N Y Y
    8 32320 N Y Y
    5 32941 N Y Y
    1 48357 N N Y
    77 47897 N N Y
    
    The -b flag shows the status of the reference and modified bits of all the displayed frames. After it is shown, the reference bit of the frame is reset. When used with the -i flag, it detects which frames are accessed between each interval.
    
    Note: Use this flag with caution because of its performance impacts.
    
    List of Top Memory Usage of Segments
    
    The -S option is used to sort segments by memory usage and to display the memory-usage statistics for the top memory-usage segments. If count is not specified, then a count of 10 is implicit. The following command sorts system and non-system segments by the number of pages in real memory and prints out the top 10 segments of the resulting list.
    
    # svmon -Sau
    
    Segid Type Description Inuse Pin Pgspace Address Range
    0 work kernel 1990 1408 3722 0..32767 : 32768..65535
    1 work private, pid=4042 1553 1 1497 0..1907 : 65307..65535
    1435 work private, pid=3006 1391 3 1800 0..4565 : 65309..65535
    11f5 work private, pid=14248 1049 1 1081 0..1104 : 65307..65535
    11f3 clnt 991 0 0 0..1716
    681 clnt 960 0 0 0..1880
    909 work shared library text 900 0 8 0..65535
    101 work vmm data 497 496 1 0..27115 : 43464..65535
    a0a work shared library data 247 0 718 0..65535
    1bf9 work private, pid=21094 221 1 320 0..290 : 65277..65535
    
    All output fields are described in the previous examples.
    
    An example output from AIX 4.3.3 and later is similar to the following:
    
    # svmon -Sut 10
    
    Vsid Esid Type Description Inuse Pin Pgsp Virtual Addr Range
    1966 - work 9985 4 31892 32234 0..32272 :
    65309..65535
    14c3 - work 5644 1 161 5993 0..6550 :
    65293..65535
    5453 - work 3437 1 2971 4187 0..4141 :
    65303..65535
    4411 - work 3165 0 1264 1315 0..65535
    5a1e - work 2986 1 13 2994 0..3036 :
    65295..65535
    340d - work misc kernel tables 2643 0 993 2645 0..15038 :
    63488..65535
    380e - work kernel pinned heap 2183 1055 1416 2936 0..65535
    0 - work kernel seg 2044 1455 1370 4170 0..32767 :
    65475..65535
    6afb - pers /dev/notes:92 1522 0 - - 0..10295
    2faa - clnt 1189 0 - - 0..2324
    
    Correlating svmon and vmstat Outputs
    
    There are some relationships between the svmon and vmstat outputs. The svmon report of AIX 4.3.2 follows (the example is the same with AIX 4.3.3 and later, although the output format is different):
    
    # svmon -G
    m e m o r y i n u s e p i n p g s p a c e
    size inuse free pin work pers clnt work pers clnt size inuse
    16384 16254 130 2016 11198 2537 2519 2016 0 0 40960 13392
    
    The vmstat command was run in a separate window while the svmon command was running. The vmstat report follows:
    
    # vmstat 5
    kthr memory page faults cpu
    ----- ----------- ------------------------ ------------ -----------
    r b avm fre re pi po fr sr cy in sy cs us sy id wa
    0 0 13392 130 0 0 0 0 2 0 125 140 36 2 1 97 0
    0 0 13336 199 0 0 0 0 0 0 145 14028 38 11 22 67 0
    0 0 13336 199 0 0 0 0 0 0 141 49 31 1 1 98 0
    0 0 13336 199 0 0 0 0 0 0 142 49 32 1 1 98 0
    0 0 13336 199 0 0 0 0 0 0 145 49 32 1 1 99 0
    0 0 13336 199 0 0 0 0 0 0 163 49 33 1 1 92 6
    0 0 13336 199 0 0 0 0 0 0 142 49 32 0 1 98 0
    
    The global svmon report shows related numbers. The vmstatfre column relates to the svmon memory free column. The number that vmstat reports as Active Virtual Memory (avm) is reported by the svmon command as pg space inuse (13392).
    
    The vmstat avm column provides the same figures as the pg space inuse column of the svmon command except starting with AIX 4.3.2 where Deferred Page Space Allocation is used. In that case, the svmon command shows the number of pages actually paged out to paging space whereas the vmstat command shows the number of virtual pages accessed but not necessarily paged out (see Looking at Paging Space and Virtual Memory).
    
    Correlating svmon and ps Outputs
    
    There are some relationships between the svmon and ps outputs. The svmon report of AIX 4.3.2 follows (the example is the same with AIX 4.3.3 and later, although the output format is different):
    
    # svmon -P 7226
    
    Pid Command Inuse Pin Pgspace
    7226 telnetd 936 1 69
    
    Pid: 7226
    Command: telnetd
    
    Segid Type Description Inuse Pin Pgspace Address Range
    828 pers /dev/hd2:15333 0 0 0 0..0
    1d3e work lib data 0 0 28 0..559
    909 work shared library text 930 0 8 0..65535
    1cbb work sreg[3] 0 0 1 0..0
    1694 work private 6 1 32 0..24 : 65310..65535
    12f6 pers code,/dev/hd2:69914 0 0 0 0..11
    
    Compare with the ps report, which follows:
    
    # ps v 7226
    PID TTY STAT TIME PGIN SIZE RSS LIM TSIZ TRS %CPU %MEM COMMAND
    7226 - A 0:00 51 240 24 32768 33 0 0.0 0.0 telnetd
    
    SIZE refers to the virtual size in KB of the data section of the process (in paging space). This number is equal to the number of working segment pages of the process that have been touched (that is, the number of paging-space pages that have been allocated) times 4. It must be multiplied by 4 because pages are in 4 K units and SIZE is in 1 K units. If some working segment pages are currently paged out, this number is larger than the amount of real memory being used. The SIZE value (240) correlates with the Pgspace number from the svmon command for private (32) plus lib data (28) in 1 K units.
    
    RSS refers to the real memory (resident set) size in KB of the process. This number is equal to the sum of the number of working segment and code segment pages in memory times 4. Remember that code segment pages are shared among all of the currently running instances of the program. If 26 ksh processes are running, only one copy of any given page of the ksh executable program would be in memory, but the ps command would report that code segment size as part of the RSS of each instance of the ksh program. The RSS value (24) correlates with the Inuse numbers from the svmon command for private (6) working-storage segments, for code (0) segments, and for lib data (0) of the process in 1-K units.
    
    TRS refers to the size of the resident set (real memory) of text. This is the number of code segment pages times four. As was noted earlier, this number exaggerates memory use for programs of which multiple instances are running. This does not include the shared text of the process. The TRS value (0) correlates with the number of the svmon pages in the code segment (0) of the Inuse column in 1 K units. The TRS value can be higher than the TSIZ value because other pages, such as the XCOFF header and the loader section, may be included in the code segment.
    
    The following calculations can be made for the values mentioned:
    
    SIZE = 4 * Pgspace of (work lib data + work private)
    RSS = 4 * Inuse of (work lib data + work private + pers code)
    TRS = 4 * Inuse of (pers code)
    
    Calculating the Minimum Memory Requirement of a Program
    
    To calculate the minimum memory requirement of a program, the formula would be:
    
    Total memory pages (4 KB units) = T + ( N * ( PD + LD ) ) + F
    
    where:
    
    T
    = Number of pages for text (shared by all users)
    
    N
    = Number of copies of this program running simultaneously
    
    PD
    = Number of working segment pages in process private segment
    
    LD
    = Number of shared library data pages used by the process
    
    F
    = Number of file pages (shared by all users)
    
    Multiply the result by 4 to obtain the number of kilobytes required. You may want to add in the kernel, kernel extension, and shared library text segment values to this as well even though they are shared by all processes on the system. For example, some applications like CATIA and databases use very large shared library modules. Note that because we have only used statistics from a single snapshot of the process, there is no guarantee that the value we get from the formula will be the correct value for the minimum working set size of a process. To get working set size, one would need to run a tool such as the rmss command or take many snapshots during the life of the process and determine the average values from these snapshots (see Assessing Memory Requirements Through the rmss Command).
    
    If we estimate the minimum memory requirement for the program pacman, shown in Finding Memory-Leaking Programs, the formula would be:
    
    T
    = 2 (Inuse of code,/dev/lv01:12302 of pers)
    
    PD
    = 1632 (Inuse of private of work)
    
    LD
    = 12 (Inuse of lib data of work)
    
    F
    = 1 (Inuse of /dev/hd2:53289 of pers
    
    That is: 2 + (N * (1632+ 12)) + 1, equal to 1644 * N + 3 in 4 KB units.


    需要注意一点是,svmon会将UNIX上的文件系统缓存对应到曾经申请过这些文件页的进程身上。可笑的是,这些文件系统缓存是不受Oracle本身控制的,他既不是PGA亦不是SGA,这些缓存是受AIX操作系统分配并被排他式地控制着(controlled exclusively).以缓存文件为目的的这部分内存不在我们考虑的Oracle内存使用问题的范畴内,因为这部分内存实际是被AIX所支配着,与我们讨论的PGA/SGA没有联系,如果我们的环境中全部是裸设备(raw device)的话(当然这不太可能),就不存在大量文件系统缓存的问题了。当然这也不意味着这部分在我们考虑总的内存使用时被忽略或漠视,因为这部分文件系统缓存同样会消耗大量物理内存并可能引起不必要的换页操作。我们可以通过”svmon -Pau 10″来了解这部分内存的使用状况;在AIX上著名的性能调优工具virtual memory optimizer,原先的vmtume,现在的vmo工具,可以帮助我们调节文件系统内存的具体阀值如 maxperm,minperm,strict_maxperm(这里不做展开)。有兴趣的话可以参考下面引用的这篇文档:


    Tuning VMM Page Replacement with the vmtune Command
    
    The memory management algorithm, discussed in Real-Memory Management, tries to keep the size of the free list and the percentage of real memory occupied by persistent segment pages within specified bounds. These bounds can be altered with the vmtune command, which can only be run by the root user. Changes made by this tool remain in effect until the next reboot of the system. To determine whether the vmtune command is installed and available, run the following command:
    
    # lslpp -lI bos.adt.samples
    
    Note: The vmtune command is in the samples directory because it is very VMM-implementation dependent. The vmtune code that accompanies each release of the operating system is tailored specifically to the VMM in that release. Running the vmtune command from one release on a different release might result in an operating-system failure. It is also possible that the functions of vmtune may change from release to release. Do not propagate shell scripts or /etc/inittab entries that include the vmtune command to a new release without checking the vmtune documentation for the new release to make sure that the scripts will still have the desired effect.
    
    Executing the vmtune command on AIX 4.3.3 with no options results in the following output:
    
    # /usr/samples/kernel/vmtune
    vmtune:  current values:
    -p       -P        -r          -R         -f       -F       -N        -W
    minperm  maxperm  minpgahead maxpgahead  minfree  maxfree  pd_npages maxrandwrt
    52190   208760       2          8        120      128     524288        0
    
    -M      -w      -k      -c        -b         -B           -u        -l    -d
    maxpin npswarn npskill numclust numfsbufs hd_pbuf_cnt lvm_bufcnt lrubucket defps
    
    209581    4096    1024       1      93         96          9      131072     1
    
    -s              -n         -S           -h
    sync_release_ilock  nokillroot  v_pinshm  strict_maxperm
    0               0           0             0
    
    number of valid memory pages = 261976   maxperm=79.7% of real memory
    maximum pinable=80.0% of real memory    minperm=19.9% of real memory
    number of file memory pages = 19772     numperm=7.5% of real memory
    
    The output shows the current settings for all the parameters.
    Choosing minfree and maxfree Settings
    
    The purpose of the free list is to keep track of real-memory page frames released by terminating processes and to supply page frames to requestors immediately, without forcing them to wait for page steals and the accompanying I/O to complete. The minfree limit specifies the free-list size below which page stealing to replenish the free list is to be started. The maxfree parameter is the size above which stealing will end.
    
    The objectives in tuning these limits are to ensure that:
    
    * Any activity that has critical response-time objectives can always get the page frames it needs from the free list.
    * The system does not experience unnecessarily high levels of I/O because of premature stealing of pages to expand the free list.
    
    The default value of minfree and maxfree depend on the memory size of the machine. The default value of maxfree is determined by this formula:
    
    maxfree = minimum (# of memory pages/128, 128)
    
    By default the minfree value is the value of maxfree - 8. However, the difference between minfree and maxfree should always be equal to or greater than maxpgahead. Or in other words, the value of maxfree should always be greater than or equal to minfree plus the size of maxpgahead. The minfree/maxfree values will be different if there is more than one memory pool. Memory pools were introduced in AIX 4.3.3 for MP systems with large amounts of RAM. Each memory pool will have its own minfree/maxfree which are determined by the previous formulas, but the minfree/maxfree values shown by the vmtune command will be the sum of the minfree/maxfree for all memory pools.
    
    Remember, that minfree pages in some sense are wasted, because they are available, but not in use. If you have a short list of the programs you want to run fast, you can investigate their memory requirements with the svmon command (see Determining How Much Memory Is Being Used), and set minfree to the size of the largest. This technique risks being too conservative because not all of the pages that a process uses are acquired in one burst. At the same time, you might be missing dynamic demands that come from programs not on your list that may lower the average size of the free list when your critical programs run.
    
    A less precise but more comprehensive tool for investigating an appropriate size for minfree is the vmstat command. The following is a portion of a vmstat command output obtained while running an C compilation on an otherwise idle system.
    
    # vmstat 1
    kthr     memory             page              faults        cpu
    ----- ----------- ------------------------ ------------ -----------
    r  b   avm   fre  re  pi  po  fr   sr  cy  in   sy  cs us sy id wa
    0  0  3085   118   0   0   0   0    0   0 115    2  19  0  0 99  0
    0  0  3086   117   0   0   0   0    0   0 119  134  24  1  3 96  0
    2  0  3141    55   2   0   6  24   98   0 175  223  60  3  9 54 34
    0  1  3254    57   0   0   6 176  814   0 205  219 110 22 14  0 64
    0  1  3342    59   0   0  42 104  249   0 163  314  57 43 16  0 42
    1  0  3411    78   0   0  49 104  169   0 176  306  51 30 15  0 55
    1  0  3528   160   1   0  10 216  487   0 143  387  54 50 22  0 27
    1  0  3627    94   0   0   0  72  160   0 148  292  79 57  9  0 34
    1  0  3444   327   0   0   0  64  102   0 132  150  41 82  8  0 11
    1  0  3505   251   0   0   0   0    0   0 128  189  50 79 11  0 11
    1  0  3550   206   0   0   0   0    0   0 124  150  22 94  6  0  0
    1  0  3576   180   0   0   0   0    0   0 121  145  30 96  4  0  0
    0  1  3654   100   0   0   0   0    0   0 124  145  28 91  8  0  1
    1  0  3586   208   0   0   0  40   68   0 123  139  24 91  9  0  0
    
    Because the compiler has not been run recently, the code of the compiler itself must be read in. All told, the compiler acquires about 2 MB in about 6 seconds. On this 32 MB system, maxfree is 64 and minfree is 56. The compiler almost instantly drives the free list size below minfree, and several seconds of rapid page-stealing activity take place. Some of the steals require that dirty working segment pages be written to paging space, which shows up in the po column. If the steals cause the writing of dirty permanent segment pages, that I/O does not appear in the vmstat report (unless you have directed the vmstat command to report on the I/O activity of the physical volumes to which the permanent pages are being written).
    
    This example describes a fork() and exec() environment (not an environment where a process is long lived, such as in a database) and is not intended to suggest that you set minfree to 500 to accommodate large compiles. It suggests how to use the vmstat command to identify situations in which the free list has to be replenished while a program is waiting for space. In this case, about 2 seconds were added to the compiler execution time because there were not enough page frames immediately available. If you observe the page frame consumption of your program, either during initialization or during normal processing, you will soon have an idea of the number page frames that need to be in the free list to keep the program from waiting for memory.
    
    If we concluded from the example above that minfree needed to be 128, and we had set maxpgahead to 16 to improve sequential performance, we would use the following vmtune command:
    
    # /usr/samples/kernel/vmtune -f 128 -F 144
    
    Tuning Memory Pools
    
    In operating system versions later than AIX 4.3.3, the vmtune -m number_of_memory_pools command allows you to change the number of memory pools that are configured at system boot time. The -m flag is therefore not a dynamic change. The change is written to the kernel file if it is an MP kernel (the change is not allowed on a UP kernel). A value of 0 restores the default number of memory pools.
    
    By default, the vmtune -m command writes to the file /usr/lib/boot/unix_mp, but this can be changed with the command vmtune -U path_to_unix_file. Before changing the kernel file, the vmtune command saves the original file as name_of_original_file.sav.
    Tuning lrubucket to Reduce Memory Scanning Overhead
    
    Tuning lrubucket can reduce scanning overhead on large memory systems. In AIX 4.3, a new parameter lrubucket was added. The page-replacement algorithm scans memory frames looking for a free frame. During this scan, reference bits of pages are reset, and if a free frame has not been found, a second scan is done. In the second scan, if the reference bit is still off, the frame will be used for a new page (page replacement).
    
    On large memory systems, there may be too many frames to scan, so now memory is divided up into buckets of frames. The page-replacement algorithm will scan the frames in the bucket and then start over on that bucket for the second scan before moving on to the next bucket. The default number of frames in this bucket is 131072 or 512 MB of RAM. The number of frames is tunable with the command vmtune -l, and the value is in 4 K frames.
    Choosing minperm and maxperm Settings
    
    The operating system takes advantage of the varying requirements for real memory by leaving in memory pages of files that have been read or written. If the file pages are requested again before their page frames are reassigned, this technique saves an I/O operation. These file pages may be from local or remote (for example, NFS) file systems.
    
    The ratio of page frames used for files versus those used for computational (working or program text) segments is loosely controlled by the minperm and maxperm values:
    
    * If percentage of RAM occupied by file pages rises above maxperm, page-replacement steals only file pages.
    * If percentage of RAM occupied by file pages falls below minperm, page-replacement steals both file and computational pages.
    * If percentage of RAM occupied by file pages is between minperm and maxperm, page-replacement steals only file pages unless the number of file repages is higher than the number of computational repages.
    
    In a particular workload, it might be worthwhile to emphasize the avoidance of file I/O. In another workload, keeping computational segment pages in memory might be more important. To understand what the ratio is in the untuned state, we use the vmtune command with no arguments.
    
    # /usr/samples/kernel/vmtune
    vmtune:  current values:
    -p       -P        -r          -R         -f       -F       -N        -W
    minperm  maxperm  minpgahead maxpgahead  minfree  maxfree  pd_npages maxrandwrt
    52190   208760       2          8        120      128     524288        0
    
    -M      -w      -k      -c        -b         -B           -u        -l    -d
    maxpin npswarn npskill numclust numfsbufs hd_pbuf_cnt lvm_bufcnt lrubucket defps
    209581    4096    1024       1      93         96          9      131072     1
    
    -s              -n         -S           -h
    sync_release_ilock  nokillroot  v_pinshm  strict_maxperm
    0               0           0             0
    
    number of valid memory pages = 261976   maxperm=79.7% of real memory
    maximum pinable=80.0% of real memory    minperm=19.9% of real memory
    number of file memory pages = 19772     numperm=7.5% of real memory
    
    The default values are calculated by the following algorithm:
    
    minperm (in pages) = ((number of memory frames) - 1024) * .2
    maxperm (in pages) = ((number of memory frames) - 1024) * .8
    
    The numperm value gives the number of file pages in memory, 19772. This is 7.5 percent of real memory.
    
    If we know that our workload makes little use of recently read or written files, we may want to constrain the amount of memory used for that purpose. The following command:
    
    # /usr/samples/kernel/vmtune -p 15 -P 50
    
    sets minperm to 15 percent and maxperm to 50 percent of real memory. This would ensure that the VMM would steal page frames only from file pages when the ratio of file pages to total memory pages exceeded 50 percent. This should reduce the paging to page space with no detrimental effect on the persistent storage. The maxperm value is not a strict limit, it is only considered when the VMM needs to perform page replacement. Because of this, it is usually safe to reduce the maxperm value on most systems.
    
    On the other hand, if our application frequently references a small set of existing files (especially if those files are in an NFS-mounted file system), we might want to allow more space for local caching of the file pages by using the following command:
    
    # /usr/samples/kernel/vmtune -p 30 -P 90
    
    NFS servers that are used mostly for reads with large amounts of RAM can benefit from increasing the value of maxperm. This allows more pages to reside in RAM so that NFS clients can access them without forcing the NFS server to retrieve the pages from disk again.
    
    Another example would be a program that reads 1.5 GB of sequential file data into the working storage of a system with 2 GB of real memory. You may want to set maxperm to 50 percent or less, because you do not need to keep the file data in memory.
    Placing a Hard Limit on Persistent File Cache with strict_maxperm
    
    Starting with AIX 4.3.3, a new vmtune option (-h) called strict_maxperm has been added. This option, when set to 1, places a hard limit on how much memory is used for a persistent file cache by making the maxperm value be the upper limit for this file cache. When the upper limit is reached, the least recently used (LRU) is performed on persistent pages.


    另一个可以尝试的工具是”ps vg”命令,一般来说每个AIX版本上都默认存在”ps”命令。输入”ps v”命令后紧跟上进程号,可以显示该进程号对应进程
    的较详细内存使用状况,注意在”v”之前是没有”-“号的,以下是”ps -lf”命令和”ps v”命令的对比:


    $ps -lfp  5029994
    F S      UID     PID    PPID   C PRI NI ADDR    SZ    WCHAN    STIME    TTY  TIME CMD
    240001 A  orauser 5029994       1   0  60 20 1d2e7b510 98000            Apr 15      - 190:34 ora_pmon_DEC
    
    $ps v   5029994
    PID    TTY STAT  TIME PGIN  SIZE   RSS   LIM  TSIZ   TRS %CPU %MEM COMMAND
    5029994      - A    190:34    4  9152 144536    xx 88849 135384  0.0  0.0 ora_pm


    “ps v”命令显示了我们感兴趣的RSS和TRS值,RSS也就是我们说的驻留集,其等于工作段页数(working-segment)*4 + 代码段(code segment) *4,单位为kbytes,而TRS值则仅等于代码段(code segment)*4 kbytes。
    请注意AIX平台上内存页的单位为4096 bytes即4k一页,这就是为什么以上RSS和TRS值需要乘以四,举例来说在实际内存使用中代码段占用了2页内存(2 * 4096bytes= 8k),则显示的TRS值应为8。由于RSS既包含了work_segment又包含了code_segment,则RSS-TRS所仅余为工作段内存(work_segment),或曰私有内存段(private memory)。以上例而言,pmon后台进程所用内存:


    144536(RSS)-135384(TRS)=9152
    9152*1024=9371648 bytes

    则pmon后台进程所用私有内存为9152k(9371648 bytes),而非”ps -lf”命令所显示的95MB(98000k)。


    TRS即代码段所用内存大致与$ORACLE_HOME/bin/oracle 2进制文件的大小相仿,每个Oracle进程(前后台进程)都需要引用到该oracle 2进制文件,实际该code_segment代码段概念即Unix C中正文段(text)的概念。
    如果您真的有闲心想要计算Oracle后台进程内存使用总量,那么可以尝试使用一下公式估算:


    (P1.RSS-P1.TRS)+(P2.RSS-P2.TRS)+(P3.RSS-P3.TRS)+…+(Pn.RSS-Pn.TRS)+ TRS + SGA


    前台进程的所使用的私有内存计算要复杂上一些,因为前台进程更频繁地使用的私有内存,同时Oracle会尝试回收部分内存,所以其波动更大。你可以多试几次”ps v”命令以便察觉当前窥视的前台进程内存使用是否存在颠簸。
    呵呵,在AIX这个黑盒上想要了解Oracle内存使用的细节还真有些难度,实在不行我们就猜吧!

    DIAG Background process may consume Large PGA Size

    Found that background process of diag is occupied high pga memory usage in RAC of node 1.
    Value of PGA memory usage is captured by “select sid, name, value from v$statname n, v$sesstat s where n.statistic# = s.statistic# and n.name like ‘%memory%’ and s.sid=481order by sid;”

    Why occuried high pga memory usage of background process of diag in node 1??

    ====================================================================================================
    SID/Serial : 481,1
    Foreground : PID: 14326 – oracle@askmac.cn (DIAG)
    Shadow : PID: 14326 – oracle@askmac.cn (DIAG)
    Terminal : UNKNOWN/ UNKNOWN
    OS User : oracle on askmac.cn
    Ora User :
    Status Flags: ACTIVE DEDICATED BACKGROUND
    Tran Active : NONE
    Login Time : Fri 17:10:26
    Last Call : Fri 17:10:27 – 8,251.4 min
    Lock/ Latch : NONE/ NONE
    Latch Spin : NONE
    Current SQL statement:
    Previous SQL statement:
    Session Waits:
    EVENT P2TEXT P2 seconds_in_w
    —————————– ———— ———— ————
    DIAG idle wait where 1 0
    ====================================================================================================

    RAC-node 1
    ===========

    SID NAME VALUE
    ———- —————————————————————- ———-
    481 session uga memory 180984
    481 session uga memory max 180984
    481 session pga memory 1647496248
    481 session pga memory max 1647496248
    481 redo k-bytes read (memory) 0
    481 redo k-bytes read (memory) by LNS 0
    481 workarea memory allocated 0
    481 sorts (memory) 0

    RAC-node 2
    ===========

    SID NAME VALUE
    ———- —————————————————————- ———-
    481 session uga memory 180984
    481 session uga memory max 180984
    481 session pga memory 5950520
    481 session pga memory max 5950520
    481 redo k-bytes read (memory) 0
    481 redo k-bytes read (memory) by LNS 0
    481 workarea memory allocated 0
    481 sorts (memory) 0

    Bug 5092124 : PGA MEMORY FOR DIAG PROCESS LEAKS WHEN DUMPING KST TRACE

    1. Please provide the output of the following query:
    sql> select a.sid,a.program,b.name,c.value from v$session a,v$sysstat b,v$sesstat c where a.program like ‘%DIAG%’ and a.sid = c.sid and b.name like ‘%pga%’ and b.statistic# = c.statistic#;

    2. Provide the output of the following command:
    ps -ef | grep diag

    3. Perform following test case:

    1. Confirm the size of DIAG’s PGA.
    .
    select a.sid,a.program,b.name,c.value from v$session a,v$sysstat b,v$sesstat c where a.program like ‘%DIAG%’ and a.sid = c.sid and b.name like ‘%pga%’
    and b.statistic# = c.statistic#;
    .
    SID PROGRAM NAME VALUE
    —– ———————– ———————- ———-
    169 oracle@jpdel1380 (DIAG) session pga memory 798524
    169 oracle@jpdel1380 (DIAG) session pga memory max 798524
    .
    2. Connect 50 sessions via sqlplus.
    .
    3. Kill one of shadow process.
    .
    Eg.
    % ps -ef | grep rac1022
    rac1022 15626 15618 0 20:31 ? 00:00:00 oraclerac10221
    (DESCRIPTION=(LOCAL=YES)(ADDRESS=(PROTOCOL=beq)))
    .
    % kill -11 15626
    .
    4. DIAG dump KST traces under cdmp_xxxxx directory.
    .
    5. Confirm the size of DIAG’s PGA.
    .
    SID PROGRAM NAME VALUE
    —– ———————– ———————- ———-
    169 oracle@jpdel1380 (DIAG) session pga memory 2699068
    169 oracle@jpdel1380 (DIAG) session pga memory max 2699068
    .
    6. Perform the same steps as 2-5.
    Confirm the size of DIAG’s PGA.
    SID PROGRAM NAME VALUE
    —– ———————– ———————- ———-
    169 oracle@jpdel1380 (DIAG) session pga memory 3944252
    169 oracle@jpdel1380 (DIAG) session pga memory max 3944252

    ==> PGA for DIAG process increases.

    1. AWR report of one hour from all the instances when the pga usage is high by diag.
    2. Database alert.log file from all the instances.
    3. init.ora or spfile used in the db.
    4. output of the following :
    show parameter “_trace_buffer”

    沪ICP备14014813号-2

    沪公网安备 31010802001379号