Latches and Tuning:Redo Log Buffer and Latches

1. The size of the redo log buffer is determined by the LOG_BUFFER parameter.

a.  Determine the size of the LOG_BUFFER by executing the following query:> select * from v$sga;

b.  View the LOG_BUFFER setting in the init.ora file.

2.  There are three latches associated with the redo log buffer.

a.  Execute the following query to view the latches:> select name from v$latchname where name like ‘redo%’;

There will be more discussion about these latches later in the module.

3.  A number of parameters that effect latch performance have been made obsolete in Oracle8i.
a.  Execute the following query to view the obsolete redo buffer parameters:

> select ksppinm from x$ksppi where ksppinm like ‘_log%’;

Of the parameters listed, _LOG_SIMULTANEOUS_COPIES  and _LOG_IO_SIZE are now obsolete.  LOG_SMALL_ENTRY_MAX_SIZE and LOG_ENTRY_PREBUILD_THRESHOLD are no longer available in Oracle8i.

_LOG_SIMULTANEOUS_COPIES effects the redo copy latch, but since the redo copy is always acquired there is no need to set this parameter.
_LOG_IO_SIZE effects the redo writing latch.

b.  Execute the following query to view the redo related parameters that are still available in Oracle8i:

> select name from v$system_parameter where name like ‘log%’;

You should see the parameters log_buffer, log_checkpoint_interval, and log_checkpoint_timeout.

4. There are 10 wait events associated with the redo log buffer and latches.

a.  View the wait events by executing the following query:> select name from v$event_name where name like ‘log%’;

Of the events that are listed, three are of primary importance:

Log buffer space: a process is waiting for space in the log buffer
Log file sync: the time it takes for LGWR to complete the write then post the requester.
Log file parallel write: the main event waited while writing the redo records to the current log file.

b. You can also gather event information from the V$SYSTEM_EVENT view by executing the following query:

> select event,total_waits,total_timeouts,time_waited from v$system_event where
event in (‘log buffer space’,’log file sync’,’log file parallel write’);

In a well tuned system redo-related waits should be none or minimal.  If one of the events is not listed in the output that means no event has occurred.

5.  There are 14 statistics associated with the redo log buffer and latches.

a.  Execute the following query to view the statistics:> select name from v$sysstat where name like ‘redo%’;

The most important statistics are:

Redo Writes: number of times the log buffer is written.
Redo Blocks Written: total number of blocks written.
Redo Log Space Requests: number of times requested to allocate space in the log file.
Redo Size, Redo Entries: how much redo is generated since instance statrup
Redo Buffer Allocation Retries: total number of retries necessary to allocate space in the redo buffer.

6.  Contention for redo log buffers does not generally cause major performance problems on the database. Waits for
the event log buffer space could indicate contention for the redo log buffers.  However, it may be more useful to find
out the proportion of redo entries which had to wait for space to become available.
a.  Execute the following query to determine the ratio:

> select r.value, s.value, r.value/s.value
from v$sysstat r, v$sysstat s
where r.name = ‘redo buffer allocation retries’ and
s.name = ‘redo entries’;;

The ratio should be near zero.

7. Remember from the first practice that there are three latches associated with the redo log buffer; redo allocation,
redo copy, and redo writing.  The tuning goal is to minimize contention and waits for these latches.

a.  To tune the latches, look at the latch statistics and the ratio of MISSES to GETS by executing the following query:> select n.name, gets, misses, immediate_gets, immediate_misses
from v$latch l, v$latchname n
where n.name in (‘redo allocation’,’redo copy’,’redo writing’)
and n.latch#= l.latch#;

If the ratio of MISSES to GETS exceeds 1%, or the ratio of IMMEDIATE_MISSES to (IMMEDIATE_MISSES+IMMEDIATE_GETS) exceeds 1%, there is latch contention.

To return the ratios you can execute the following query.  However, you may receive a division by zero error.

> select n.name, gets, misses, immediate_gets, immediate_misses, (misses/gets),
(immediate_misses/(immediate_misses+immediate_gets))
from v$latch l, v$latchname n
where n.name in (‘redo allocation’,’redo copy’,’redo writing’)
and n.latch#= l.latch#;

8.  You can increase the number of redo copy latches by setting the parameter LOG_SIMULTANEOUS_COPIES.
This parameter is a hidden parameter and must be set in the init.ora and the database must be restarted for it
to take effect.

a.  One method for determing the number of redo copy latches is to query the V$LATCH_CHILDREN view.  There will be one latch for the value of _LOG_SIMULTANEOUS_COPIES.  If there is only one latch, you will have to query V$LATCH_PARENT as there will be no children.> select name from v$latch_children where name = ‘redo copy’;

b.  If you want to increase or decrease the number of redo copy latches, modify the parameter _LOG_SIMULTANEOUS_COPIES in the init.ora file.  Once you have done this, you can bounce the
database and execute the query in step a.

9.  You can increase the number of redo writing latches by modifying the parameter _LOG_IO_SIZE.  This
parameter is a hidden parameter and must be set in the init.ora and the database must be restarted for it to take
effect.
a.  One method for determing the number of redo copy latches is to query the V$LATCH_CHILDREN view.  There will be one latch for the value of _LOG_IO_SIZE.  If there is only one latch, you will have to query V$LATCH_PARENT as there will be no children.

> select name from v$latch_children where name = ‘redo writing’;

b.  If you want to increase or decrease the number of redo copy latches, modify the parameter
_LOG_IO_SIZE in the init.ora file.  Once you have done this, you can bounce the database and execute the
query in step a.

Latches and Tuning:Buffer Cache

1.  The buffer pool is structured into pools; RECYCLE, KEEP, and DEFAULT.  Unless otherwise specified at create time or altered, an object will reside in the DEFAULT pool.

a. Suppose you have a table that is frequently updated, but is a relatively small table.  You would want to ensure the blocks for this table are stored in the KEEP pool of the buffer cache.  Execute the following command to create the table TEST1 in the KEEP pool.> create table TEST1 (n number) storage (buffer_pool KEEP);

b.  Suppose you have a large table that is randomly accessed.  You want to ensure the blocks for this table are stored in the RECYCLE pool.  Execute the following command to create the table TEST2 in the RECYCLE pool:

> create table TEST2 (n nmber) storage (buffer_pool RECYCLE);

c.  Suppose you have a table that is subjected to normal access. You want to ensure the blocks for this table are stored in the DEFAULT pool. Execute the following command to create the table TEST3 in the DEFAULT pool:

> create table TEST3 (n number) storage (buffer_pool DEFAULT);

d.  Query the USER_TABLES view to see the table names and the pools to which they are assigned:

> select table_name, buffer_pool from user_tables where table_name like ‘TEST%’;

You can use the ALTER TABLE command to change the buffer pool for a table.

2. Various statistics are incremented during buffer management.
a.  Execute the following query to view the relevants statistics:

> select * from v$sysstat where name in (‘dirty buffers inspected’,’free buffer inspected’);

– dirty buffers inspected: incremented when dirty buffers are read and moved to the LRUW list.
– free buffers inspected: incremented when free buffers are detected during the search for a free buffer on the LRU list.

3. The parameter DB_BLOCK_LRU_LATCHES defines the number of working sets for the instance.

a.   Determine the value of DB_BLOCK_LRU_LATCHES by executing the following query:> select name,value from v$system_parameter where name = ‘db_block_lru_latches’;

4.  There is one working set per DB_BLOCK_LRU_LATCHES.

a.  Query the X$KCBWDS view to determine the number of working sets for the instance.> select count(*) from x$kcbwds;

The returned values should be the same as the value for DB_BLOCK_LRU_LATCHES.

5.  Each working set also has its own checkpoint latch.

a.  Execute the following query to view the checkpoint latch and set id’s for the instance:> select addr,set_id,ckpt_latch,set_latch,dbwr_num from x$kcbwds;

b.  Using one of the ckpt_latch values, execute the following query:

> select * from v$latch_children where addr = <address from query>;

With this you can see that there is one child latch for each checkpoint latch.

6.  The maximum number of DBWR cannot be more than the number of working sets.
a.  Set the number of DBWR processes to a value greater than DB_BLOCK_LRU_LATCHES.  Do this by changing the DB_WRITER_PROCESSES value in the init.ora.

b.  Bounce your database instance.

c.  Execute the following query:

> select dbwr_num from x$kcbwds;

You will see that the number of DBWR processes is equal to the number DB_BLOCK_LRU_LATCHES.

7. The number of DBWR processes are set using the DB_WRITER_PROCESSES parameter.

a.  View your init.ora file and determine if the number of DB_WRITER_PROCESSES has been explicitly set.

8.  Two parameters effect the way DBWR scans for purposes of making free buffers.

a  Execute the following query:

> select ksppinm from x$ksppi where ksppinm like ‘_db%scan%’;

_DB_WRITER_SCAN_DEPTH – Sets the scan depth for DBWR
_DB_BLOCK_MAX_SCAN_CNT – Sets the foregrond scan depth

The maximum number of dirty buffers in the write list, which will not cause DBWR to write is
max(DB_BLOCK_BUFFERS/8, 2*write-batch-size

9. A target value for the buffer cache hit% is 90.

a.  Determine the buffer cache % by executing the following query:> select 1 – (phy.value / (log.value + con.value )) “Buffer Cache Hit%”
from v$sysstat phy, v$sysstat log, v$sysstat con
where phy.name = ‘physical reads’ and
log.name = ‘db block gets’ and
con.name = ‘consistent gets’;

Descriptions of the buffer cache statistics used are:

– db block gets: tracks the number of blocks obtained in CURRENT mode.
– physical reads: stores the number of physical blocks when the OS retrieves a database block from disk
– consistent gets: number of times a consistent read was requested for a block.

Other buffer cache statistics include:

– physical writes
– db block changes
– free buffer requested
– dirty buffers inspected
– free buffer inspected
– CR blocks created

10.  Numerous statistics are associated with the DBWR process.

a.  Execute the following query to view the statistics associated with the DBWR process:> select name from v$sysstat where name like ‘DBWR%’;

Of the statistics listed two of the most important are DBWR checkpoints and DBWR make free requests.

11.  The number of cache buffers chains latches is equal to prime(db_block_buffers/4).  The number of cache buffers
lru chain latches is equal to the value of DB_BLOCK_LRU_LATCHES.

a.  Execute the following query to determine the approximate number of cache buffers chains latches:> select (value/4) from v$system_parameter where name = ‘db_block_buffers’;

b.  The value from the above should be approximately equal to the row count returned from the following
query:

> select count(*) from v$latch_children where name = ‘cache buffers chains’;

c.  Execute the following query to determine the number of cache buffers lru chain latches:

> select count(*) from v$latch_children where name = ‘cache buffers lru chain’;

d.  Check the value of DB_BLOCK_LRU_LATCHES and it should equal the row count returned from the first query.

12.  Wait events are also important for diagnosing buffer cache problems.  It’s the time_waited for each
event that is used for diagnostics.
a.  Execute the following query to view the two primary events associated with tuning the buffer cache:

> select * from v$system_event
where name in (‘buffer busy waits’,’free buffer waits’)
order by time_waited;

You may not see free buffer waits in the result set if there has been no wait time for this event.  It is listed in V$EVENT_NAME.

b.  Additional wait information can be derived from the views V$SESSION_WAIT and V$WAITSTAT views, and the X$KCBFWAIT table.  Query the V$WAITSTAT view to list the different types of
blocks:

> select class from v$waitstat;

Some of the most likely reasons for each block type are:

Segment Header – not enough free lists and high number of inserts
Data Blocks – too many rows in each block
Freelist Blocks – not enough free lists
Undo Header – too many transactions per rollback segment
Undo Blocks – not enough rollback segment blocks

Latches and Tuning:The Library Cache

1. The shared pool is determined by the value of SHARED_POOL_SIZE as indicated in the init.ora file.  The library
cache is part of the shared pool.

a.  Determine the size of the shared poool by executing the following query:> select name,value from v$system_parameter where name = ‘shared_pool_size’;

The shared pool size is part of the VARIABLE SIZE value returned by querying V$SGA.

2.  The hidden parameter _KGL_BUCKET_COUNT determines the initial size of the hash table.  Typically, you
will accept the default value and not change this parameter.  The maximum value is 8.

a.  Determine the initial size of the hash table by executing the following query:> select ksppinm, ksppity from x$ksppi where ksppinm  = ‘_kgl_bucket_count’;

3. Object types are stored in a namespace.  While there can be 32 different namespaces, objects of the same
type will always be stored in the same namespace.

a.  Determine the namespaces allocated in the library cache by executing the following query:> select namespace from v$librarycache;

The number of namespaces are subject to increase at any time.  Common namespaces are:

CRSR: stores library cache objects of type cursor (shared SQL statements)
TABL/PRCD/TYPE: stores tables, views, sequences, synonyms, and procedure specifications
BODY/TYBD: stores procedure, function, package, and type bodies
INDX: stores librarcy cache objects of type index
TRGR: stores librarcy cache objects of type trigger
CLST: stores librarcy cache objects of type cluster

4.  Object tables are maintained for each object.  While the contents of each X$ table are fairly obscure, you can
query them to derive information about objects.

a.  Describe and/or query one of the following tables.X$KGLDP: (Dependency Table) One entry for each object that this object depends on.  For example, a view would depend on underlying tables or views.
X$KGLTR: (Translation Table) Contains records explaining how names referenced by this object were resolved to base objects.
X$KGLAU: (Authorization Table) Contains entries for each privilege defined on the object.
X$KGLXS: (Access Table) One or more entries for each entry in the dependency table.
X$KGLRD: (Read-only dependency table) Like the dependency table but for read only objects.
X$KGLSN: (Schema Name table) Only cursors have schema name tables and they store the schema names for the objects in the authorization table.
(Child Table) One entry for each object that is a child of this object.

5.  Remember that there are 32 namespaces in the library cache.  Also, each object has three types of flags; public,
status, and special status.
a.  Determine the number of namespaces by querying the OBJ$ table:

> select distinct(namespace) from obj$;

b. You can see the name of objects, their namespace, and flags by executing the following query.  Since there are many objects the query is limited using the psuedo column rownum.

> select name,namespace,flags from obj$ where flags > 1 and rownum < 10;

6. Locks and pins are used to control acccess to library cache objects. The X$KGLLK table, as indicated by the
letters LK, records locks on library cache objects.

a.  Connect as SYS and query the X$KGLLK table using the following query:> select user_name from x$kgllk where user_name = ‘SCOTT’;

Provided SCOTT is not logged in, this query should return no rows.:

b.  Create a second SQL*PLUS session as SCOTT/TIGER.

c.  Switch to SYS’s SQL*PLUS session and execute the following query:

> select user_name, kglnaobj from x$kgllk where user_name = ‘SCOTT’;

The user SCOTT acquired object handles on the objects DBMS_APPLICATION_INFO and DBMS_OUTPUT.

d. Switch to SCOTT’s SQL*PLUS session and execute the following update statement:

> update dept set dname = ‘TEST’ where deptno = ’10’;

e. Switch to SYS’s SQL*PLUS session and execute the following query:

> select user_name, kglnaobj from x$kgllk where user_name = ‘SCOTT’;

You will see that SCOTT has acquired additional locks as a result of the update statement.

7.  The X$KGLLPN table, as indicated by the letters PN, records pins on library cache objects.  The contents of the
X$KGLPN table are obscure but you may want to take a look at the data.
a.  Describe the X$KGLN table:

> desc X$KGLN

8. Library cache contention can be caused by excessive parsing of SQL statements.

a.  Determine the parse count in the library cache by executing the following query:b.  Create a second SQL*PLUS session as SCOTT/TIGER.c.  Switch to SYS’s SQL*PLUS session and execute the following query:

> select user_name, kglnaobj from x$kgllk where user_name = ‘SCOTT’;

9.  One diagnostic you can use for determing library cache performance is querying the V$LIBRARYCACHE
view.

a.  Execute the following query:> select namespace, gets, gethitratio, pins, pinhitratio, reloads, invalidations
from v$librarycache;

  • NAMESPACE: the different library cache namespaces
  • GETS: the total number of calls to locate and lock an object in the library cache
  • PINS: total number of calls to pin an object heap (to examine and possibly change)
  • GET/PINHITRATIO: ratio of overall requests to successful acquisitions for the GET and PIN calls in the cache
  • RELOADS: object reloads due to being aged out of the library cache
  • INVALIDATIONS: number of times the object was invalidated
  • Tuning Recommendations:

  • Keep the HITRATIOS above 90%
  • Keep the RELOADS to a minimum, ideally close to zero
  • Avoid DDL and minimize user role changes in a busy production environmentto prevent INVALIDATIONS
  • Size the shared pool appropriately so as to avoid objects getting aged out of the library cache
  • Similar SQL statements must be identical to be shared – use bind variables instead of literals
  • 10.  By performing a library cache dump you can gather extensive information about the library cache.  The dump will
    show you all of the namespaces, buckets, librarcy cache statistics, and content of the librarcy cache.  Beware, if you have
    a large database this dump file can be quite large and take a long time to generate.  You may want to select the
    appropriate level 1 – 4, depending upon the information you want to see.

    a.  As user SYS, execute the following query:> alter session set events ‘immediate trace name library_cache level 4’;

    The output will be generated in the USER_DUMP_DEST directory.

  • Level 1: dump libracy cache statistics
  • Level 2: include a hash table histogram; each bucket has one asterisk for each included handle
  • Level 3: include the dump of the object handles
  • Level 4: include the dump of the object structures (heap 0 only)
  • 11.  The X$KSMLRU fixed table tracks allocations in the shared pool that cause other objects to be aged out.  This
    table can be used to identify what is causing the large allocation.

    a.  Query the X$KSMLRU fixed table:> select * from x$ksmlru where ksmlru > 4000;

    The table contents are deleted after a SELECT.  This is done because the table stores only the largest allocations that have occurred.

    b.  Describe the X$KSMLRU table:

    > desc X$KSMLRU

    KSMLRSIZ: amount of contiguous memory being allocated.  Values over 5KB start to be a problem.
    KSMLRNUM: number of objects that were flushed from the shared pool in order to allocate the memory.
    KSMLRHON: the name of the object being loaded into the shared pool if the object is a PL/SQL object or a cursor.
    KSMLROHV: hash value of object being loaded.
    KSMLRSES: SADDR of the session that loaded the object.

    12.  One way to decrease the load on the library cache latch is to reduce the number of parse calls that are coming into
    the system.

    a.  To identify statements that are receiving a lot of parse calls, execute the following statement:> select sql_text, parse_calls, executions
    from v$sqlarea
    where parse_calls > 100
    and executions< 2 * parse_calls;

    13.  An additional method to tune the library cache is to convert anonymous blocks into packages if possible.
    a.  Find anonymous  blocks by executing the following query (47 is the command for an anonymous PL/SQL block):

    > select sql_text
    from v$sqlarea
    where command_type = 47;

    Oracle等待事件:Data file init write

    在给某一个大表加有default值的clob列时出现了Data file init write等待事件,这个等待事件是10gR2中新加入的,恰恰10gr2的文档(乃至11g的文档)都没有列出该等待事件。该等待事件一般在Oracle自动扩展数据文件(auto extend datafile)并串行地格式化数据文件的新创建的空间时作为前台(foreground)等待事件出现:

    SQL> select * from v$version;
    
    BANNER
    ----------------------------------------------------------------
    Oracle Database 10g Enterprise Edition Release 10.2.0.4.0 - 64bi
    PL/SQL Release 10.2.0.4.0 - Production
    CORE    10.2.0.4.0      Production
    TNS for Linux: Version 10.2.0.4.0 - Production
    NLSRTL Version 10.2.0.4.0 - Production
    
    SQL> show parameter compatible
    
    NAME                                 TYPE        VALUE
    ------------------------------------ ----------- ------------------------------
    compatible                           string      10.2.0.3
    
    /* 数据库版本10.2.0.4,compatible为10.2.0.3 */
    
    SQL> alter table tv add spare6 clob default '........';
    SQL> col event for a30;
    
    SQL> select event, time_waited, current_file#, current_block#
      2    from V$active_Session_History
      3   where event like 'Data file init write'
      4   order by sample_time desc;
    
    EVENT                          TIME_WAITED CURRENT_FILE# CURRENT_BLOCK#
    ------------------------------ ----------- ------------- --------------
    Data file init write                533810             4          54783
    Data file init write                442042             4          54783
    Data file init write                 47286             4          54783
    Data file init write                 42932             4          54783
    Data file init write                413477             4          54783
    Data file init write                153503             4          54783
    Data file init write                 33520             4          54783
    Data file init write                307616             4          54783
    Data file init write                214404             4          54783
    Data file init write                  3400             4          54783
    Data file init write                212386             4          54783
    Data file init write                192631             4          54783
    ..............
    Data file init write                611157             4          54775
    Data file init write                  1379             4          54775
    Data file init write                223541             4          54775
    

    伴随着数据文件扩展(Data file init write等待事件的直接触发原因),Oracle需要通过以下递归dml语句维护相应的数据字典:

    1.查询字典表file$确定表空间对应的数据文件号
    select file# from file$ where ts#=:1
    该操作可能伴随Data file init write等待事件发生:
    PARSING IN CURSOR #3 len=36 dep=2 uid=0 oct=3 lid=0 tim=1261083587010014 hv=1570213724 ad='8f7d4210'
    select file# from file$ where ts#=:1
    END OF STMT
    .............
    WAIT #14: nam='Data file init write' ela= 1091 count=1 intr=256 timeout=4294967295 obj#=57314 
    WAIT #14: nam='Data file init write' ela= 1078 count=1 intr=256 timeout=4294967295 obj#=57314 
    WAIT #14: nam='Data file init write' ela= 1102 count=1 intr=256 timeout=4294967295 obj#=57314 
    WAIT #14: nam='Data file init write' ela= 1156 count=1 intr=256 timeout=4294967295 obj#=57314 
    WAIT #14: nam='Data file init write' ela= 1870 count=1 intr=256 timeout=4294967295 obj#=57314 
    WAIT #14: nam='Data file init write' ela= 37 count=1 intr=256 timeout=4294967295 obj#=57314
    WAIT #14: nam='Data file init write' ela= 4 count=4294967295 intr=32 timeout=2147483647 obj#=57314 
    
    2.若使用bigfile tablespace则可能出现以下insert seg$流程
    insert into seg$ (file#,block#,type#,ts#,blocks,extents,minexts,maxexts,
    extsize,extpct,user#,iniexts,lists,groups,cachehint,bitmapranges,hwmincr, 
    spare1, scanhint) values (:1,:2,:3,:4,:5,:6,:7,:8,:9,:10,:11,:12,:13,:14,:15,0,:16,
    DECODE(:17,0,NULL,:17),:18)
    PARSE #15:c=0,e=368,p=0,cr=0,cu=0,mis=1,r=0,dep=1,og=4,tim=1261083586909081
    BINDS #15:
    kkscoacd
     Bind#0
      oacdty=02 mxl=22(22) mxlc=00 mal=00 scl=00 pre=00
      oacflg=08 fl2=0001 frm=00 csi=00 siz=24 off=0
      kxsbbbfp=2ba79a0e1330  bln=22  avl=03  flg=05
      value=1024
    
    SQL> select file#,block#,blocks from sys.seg$ where file#=1024;
    
         FILE#     BLOCK#     BLOCKS
    ---------- ---------- ----------
          1024         82   13434880
          1024   13434962      16384
          1024   13451346      16384
          1024   13467730      16384
          1024   13484114      16384
    
    /* 会出现奇怪的1024号文件 */
    
    3.维护用户表空间限额字典数据
    update tsq$
       set blocks    = :3,
           maxblocks = :4,
           grantor#  = :5,
           priv1     = :6,
           priv2     = :7,
           priv3     = :8
     where ts# = :1
       and user# = :2
    
    4.更新seg$数据字典基表以扩展数据段
    update seg$
       set type#     = :4,
           blocks    = :5,
           extents   = :6,
           minexts   = :7,
           maxexts   = :8,
           extsize   = :9,
           extpct    = :10,
           user#     = :11,
           iniexts   = :12,
           lists     = decode(:13, 65535, NULL, :13),
           groups    = decode(:14, 6 5535, NULL, :14),
           cachehint = :15,
           hwmincr   = :16,
           spare1    = DECODE(:17, 0, NULL, :17),
           scanhint  = :18
     where ts# = :1
       and file# = :2
       and block# = :3
    

    以上数据文件空间扩展流程中只有查询语句”select file# from file$ where ts#=:1″伴随有”Data file init write”等待。

    How does RECORDLENGTH affect your exp speed?

    exp导出工具的几个常用参数想必大家都很熟悉;有时为了加速导出作业我们会加上direct=y,进一步的可能就会设置RECORDLENGTH参数了,Oracle官方对这个参数的定义是:length of IO record;这个解释过于简单了,偶有余暇来探究一下RECORDLENGTH的工作原理:

    [maclean@rh2 test]$ exp help=y
    
    Export: Release 10.2.0.4.0 - Production on Mon Nov 8 17:26:34 2010
    Copyright (c) 1982, 2007, Oracle.  All rights reserved.
    You can let Export prompt you for parameters by entering the EXP
    command followed by your username/password:
    
         Example: EXP SCOTT/TIGER
    
    Or, you can control how Export runs by entering the EXP command followed
    by various arguments. To specify parameters, you use keywords:
    
         Format:  EXP KEYWORD=value or KEYWORD=(value1,value2,...,valueN)
         Example: EXP SCOTT/TIGER GRANTS=Y TABLES=(EMP,DEPT,MGR)
                   or TABLES=(T1:P1,T1:P2), if T1 is partitioned table
    
    USERID must be the first parameter on the command line.
    
    Keyword    Description (Default)      Keyword      Description (Default)
    --------------------------------------------------------------------------
    USERID     username/password          FULL         export entire file (N)
    BUFFER     size of data buffer        OWNER        list of owner usernames
    FILE       output files (EXPDAT.DMP)  TABLES       list of table names
    COMPRESS   import into one extent (Y) RECORDLENGTH length of IO record
    GRANTS     export grants (Y)          INCTYPE      incremental export type
    INDEXES    export indexes (Y)         RECORD       track incr. export (Y)
    DIRECT     direct path (N)            TRIGGERS     export triggers (Y)
    LOG        log file of screen output  STATISTICS   analyze objects (ESTIMATE)
    ROWS       export data rows (Y)       PARFILE      parameter filename
    CONSISTENT cross-table consistency(N) CONSTRAINTS  export constraints (Y)
    
    OBJECT_CONSISTENT    transaction set to read only during object export (N)
    FEEDBACK             display progress every x rows (0)
    FILESIZE             maximum size of each dump file
    FLASHBACK_SCN        SCN used to set session snapshot back to
    FLASHBACK_TIME       time used to get the SCN closest to the specified time
    QUERY                select clause used to export a subset of a table
    RESUMABLE            suspend when a space related error is encountered(N)
    RESUMABLE_NAME       text string used to identify resumable statement
    RESUMABLE_TIMEOUT    wait time for RESUMABLE
    TTS_FULL_CHECK       perform full or partial dependency check for TTS
    VOLSIZE              number of bytes to write to each tape volume
    TABLESPACES          list of tablespaces to export
    TRANSPORT_TABLESPACE export transportable tablespace metadata (N)
    TEMPLATE             template name which invokes iAS mode export
    
    Export terminated successfully without warnings.
    
    /* 针对使用direct=y直接路径,未使用recordlength的作业进行strace系统调用追踪 */
    
    [maclean@rh2 test]$ strace -o exp1.trace exp maclean/maclean file=tv.dmp tables=tv direct=y
    
    Export: Release 10.2.0.4.0 - Production on Mon Nov 8 17:27:23 2010
    Copyright (c) 1982, 2007, Oracle.  All rights reserved.
    Connected to: Oracle Database 10g Enterprise Edition Release 10.2.0.4.0 - 64bit Production
    With the Partitioning, OLAP, Data Mining and Real Application Testing options
    Export done in US7ASCII character set and UTF8 NCHAR character set
    server uses ZHS16GBK character set (possible charset conversion)
    
    About to export specified tables via Direct Path ...
    . . exporting table                             TV    6602624 rows exported
    Export terminated successfully without warnings.
    
    [maclean@rh2 test]$ ps -ef|grep exp
    maclean  12265 12198 55 17:27 pts/2    00:00:02 strace -o exp1.trace exp maclean/maclean file=tv.dmp tables=tv direct=y
    maclean  12266 12265 24 17:27 pts/2    00:00:01 exp                 file=tv.dmp tables=tv direct=y
    maclean  12269 12233  0 17:27 pts/3    00:00:00 grep exp
    [maclean@rh2 test]$ pmap -x 12266
    12266:   exp                 file=tv.dmp tables=tv direct=y
    Address           Kbytes     RSS   Dirty Mode   Mapping
    0000000000400000     608     280       0 r-x--  exp
    0000000000698000      16      16       8 rwx--  exp
    000000000069c000      40      40      40 rwx--    [ anon ]
    000000000f330000     876     656     656 rwx--    [ anon ]
    00000039f1800000     112     100       0 r-x--  ld-2.5.so
    00000039f1a1b000       4       4       4 r-x--  ld-2.5.so
    00000039f1a1c000       4       4       4 rwx--  ld-2.5.so
    00000039f1c00000    1336     452       0 r-x--  libc-2.5.so
    00000039f1d4e000    2044       0       0 -----  libc-2.5.so
    00000039f1f4d000      16      16       8 r-x--  libc-2.5.so
    00000039f1f51000       4       4       4 rwx--  libc-2.5.so
    00000039f1f52000      20      20      20 rwx--    [ anon ]
    00000039f2000000     520      20       0 r-x--  libm-2.5.so
    00000039f2082000    2044       0       0 -----  libm-2.5.so
    00000039f2281000       4       4       4 r-x--  libm-2.5.so
    00000039f2282000       4       4       4 rwx--  libm-2.5.so
    00000039f2400000       8       8       0 r-x--  libdl-2.5.so
    00000039f2402000    2048       0       0 -----  libdl-2.5.so
    00000039f2602000       4       4       4 r-x--  libdl-2.5.so
    00000039f2603000       4       4       4 rwx--  libdl-2.5.so
    00000039f2800000      88      60       0 r-x--  libpthread-2.5.so
    00000039f2816000    2044       0       0 -----  libpthread-2.5.so
    00000039f2a15000       4       4       4 r-x--  libpthread-2.5.so
    00000039f2a16000       4       4       4 rwx--  libpthread-2.5.so
    00000039f2a17000      16       4       4 rwx--    [ anon ]
    00000039f5c00000      84      24       0 r-x--  libnsl-2.5.so
    00000039f5c15000    2044       0       0 -----  libnsl-2.5.so
    00000039f5e14000       4       4       4 r-x--  libnsl-2.5.so
    00000039f5e15000       4       4       4 rwx--  libnsl-2.5.so
    00000039f5e16000       8       0       0 rwx--    [ anon ]
    00002b6ebde28000       8       8       8 rwx--    [ anon ]
    00002b6ebde2a000   18632    5024       4 r-x--  libclntsh.so.10.1
    00002b6ebf05c000    2044       0       0 -----  libclntsh.so.10.1
    00002b6ebf25b000     656     656     640 rwx--  libclntsh.so.10.1
    00002b6ebf2ff000     112      32      32 rwx--    [ anon ]
    00002b6ebf31b000    3004    1280     416 r-x--  libnnz10.so
    00002b6ebf60a000    1020       0       0 -----  libnnz10.so
    00002b6ebf709000     708     256     256 rwx--  libnnz10.so
    00002b6ebf7ba000       4       4       4 rwx--    [ anon ]
    00002b6ebf7d8000     432     164     164 rwx--    [ anon ]
    00002b6ebf844000     400       8       0 r-x--  timezlrg.dat
    00002b6ebf8c5000      40      28       0 r-x--  libnss_files-2.5.so
    00002b6ebf8cf000    2044       0       0 -----  libnss_files-2.5.so
    00002b6ebface000       4       4       4 r-x--  libnss_files-2.5.so
    00002b6ebfacf000       4       4       4 rwx--  libnss_files-2.5.so
    00002b6ebfad0000       4       4       4 rwx--    [ anon ]
    00007ffff2cb3000      84      64      64 rwx--    [ stack ]
    ffffffffff600000    8192       0       0 -----    [ anon ]
    ----------------  ------  ------  ------
    total kB           51408    9276    2380
    [maclean@rh2 test]$ cd /proc/12266/fd
    [maclean@rh2 fd]$ ls -l
    总计 0
    lrwx------ 1 maclean oinstall 64 11-08 17:27 0 -> /dev/pts/2
    lrwx------ 1 maclean oinstall 64 11-08 17:27 1 -> /dev/pts/2
    lrwx------ 1 maclean oinstall 64 11-08 17:27 2 -> /dev/pts/2
    lr-x------ 1 maclean oinstall 64 11-08 17:27 3 -> /s01/10gdb/rdbms/mesg/expus.msb
    lr-x------ 1 maclean oinstall 64 11-08 17:27 4 -> /s01/10gdb/oracore/mesg/lrmus.msb
    lr-x------ 1 maclean oinstall 64 11-08 17:27 5 -> /s01/10gdb/rdbms/mesg/ocius.msb
    lrwx------ 1 maclean oinstall 64 11-08 17:27 6 -> socket:[56016]
    l-wx------ 1 maclean oinstall 64 11-08 17:27 7 -> /home/maclean/test/tv.dmp
    l-wx------ 1 maclean oinstall 64 11-08 17:27 8 -> pipe:[56017]
    lr-x------ 1 maclean oinstall 64 11-08 17:27 9 -> pipe:[56018]
    
    /* 同时分析该exp进程的地址空间及打开文件描述符,可以看到这里的fd=>7指向了导出文件tv.dmp */
    
    节选trace部分内容:
    read(9, "\7\333\0\0\6\0\0\0\0\0\10\0 \0\0009:57\5\0VALID\1\0N\1\0N"..., 2064) = 2064
    read(9, "2008-03-12:00:39:58\5\0VALID\1\0N\1\0N"..., 1958) = 1958
    read(9, "\7\333\0\0\6\0\0\0\0\0LID\1\0N\1\0N\1\0N\3\0SYS\v\0I_S"..., 2064) = 2064
    read(9, "\376\377\3\0\302\5$\3\0\302\5$\5\0INDEX\7\0xl\3\f\1(<\7\0xl"..., 1958) = 1958
    read(9, "\0\327\0\0\6\0\0\0\0\00059\5\0VALID\1\0N\1\0N\1\0N\5\0OU"..., 2064) = 215
    write(7, "9:57\5\0VALID\1\0N\1\0N\1\0N\3\0SYS\t\0ATEMP"..., 4096) = 4096
    write(7, "\0N\1\0N\3\0SYS\v\0I_SUMDEP$_2\376\377\3\0\302\5\17\3\0"..., 4096) = 4096
    write(8, "\0r\0\0\6\0\0\0\0\0\3[\235@\177\202\277n+\0\0\0 \0\0\0\0\0\0\200a\314"..., 114) = 114
    read(9, "\7\333\0\0\6\0\0\0\0\0\10\0 \0\0ALID\1\0N\1\0N\1\0N\5\0OU"..., 2064) = 2064
    read(9, "\0N\1\0N\1\0N\3\0SYS\t\0MON_MODS$\376\377\3\0\302\5T\3"..., 1958) = 1958
    read(9, "\7\333\0\0\6\0\0\0\0\0\1)\1\7\0xl\3\f\1)\1\23\0002008-03-"..., 2064) = 2064
    read(9, "ABLE\7\0xl\3\f\1)\26\7\0xl\3\f\1)\26\23\0002008-03-"..., 1958) = 1958
    read(9, "\0\327\0\0\6\0\0\0\0\0\302\0061\3\0\302\0061\5\0INDEX\7\0xl\3\f\1"..., 2064) = 215
    write(7, "ALID\1\0N\1\0N\1\0N\5\0OUTLN\17\0OL$NODE_OL"..., 4096) = 4096
    write(7, ")\1\7\0xl\3\f\1)\1\23\0002008-03-12:00:40:00"..., 4096) = 4096
    write(8, "\0r\0\0\6\0\0\0\0\0\3[\236@\177\202\277n+\0\0\0 \0\0\0\0\0\0\200a\314"..., 114) = 114 
    
    /* 文件描述符为9的是一个管道文件,不难猜测其数据来源于TV表所在数据文件;
       fd为8的因该是system call的输出管道,可以不用关心  */ 
    
    [maclean@rh2 test]$ strace -o exp2.trace exp maclean/maclean file=tv.dmp tables=tv direct=y recordlength=32768
    
    Export: Release 10.2.0.4.0 - Production on Mon Nov 8 18:31:07 2010
    
    Copyright (c) 1982, 2007, Oracle.  All rights reserved.
    
    Connected to: Oracle Database 10g Enterprise Edition Release 10.2.0.4.0 - 64bit Production
    With the Partitioning, OLAP, Data Mining and Real Application Testing options
    Export done in US7ASCII character set and UTF8 NCHAR character set
    server uses ZHS16GBK character set (possible charset conversion)
    
    About to export specified tables via Direct Path ...
    . . exporting table                             TV    6602624 rows exported
    Export terminated successfully without warnings.
    
    节选的recordlength为32k时的system call trace:
    
    read(9, "\7\333\0\0\6\0\0\0\0\0\10\0\200\0\0ONYM\7\0xl\3\f\2\t9\7\0xl"..., 2064) = 2064
    read(9, "\5\0VALID\1\0N\1\0N\1\0N\7\0OLAPSYS\10\0CWM$U"..., 1958) = 1958
    read(9, "\7\333\0\0\6\0\0\0\0\0002:01:09:00\5\0VALID\1\0N\1\0"..., 2064) = 2064
    read(9, "\0N\7\0OLAPSYS\26\0CWM2$AWDIMCREATEACC"..., 1958) = 1958
    read(9, "\7\333\0\0\6\0\0\0\0\0\0\303\5T\2\5\0TABLE\7\0xl\3\f\2\n\4\7"..., 2064) = 2064
    read(9, "\5T\25\4\0\303\5T\25\5\0INDEX\7\0xl\3\f\2\n\5\7\0xl\3\f\2"..., 1958) = 1958
    read(9, "\7\333\0\0\6\0\0\0\0\0\4\0\303\5T'\5\0INDEX\7\0xl\3\f\2\n\5"..., 2064) = 2064
    read(9, "ID\1\0N\1\0N\1\0N\7\0OLAPSYS\23\0CWM2$HIERA"..., 1958) = 1958
    read(9, "\7\333\0\0\6\0\0\0\0\0007:32\5\0VALID\1\0N\1\0N\1\0N\7\0"..., 2064) = 2064
    read(9, "-10-20:20:07:33\5\0VALID\1\0N\1\0N\1\0N\7"..., 1958) = 1958
    read(9, "\7\333\0\0\6\0\0\0\0\0\0VALID\1\0N\1\0N\1\0N\7\0OLAPS"..., 2064) = 2064
    read(9, "\0CWM2_OLAP_MEASURE\376\377\4\0\303\5U\"\376\377\7\0PA"..., 1958) = 1958
    read(9, "\7\333\0\0\6\0\0\0\0\0\0N\1\0N\1\0N\6\0PUBLIC\23\0CWM2"..., 2064) = 2064
    read(9, "008-03-12:01:09:11\5\0VALID\1\0N\1\0N\1"..., 1958) = 1958
    read(9, "\7\333\0\0\6\0\0\0\0\0\0N\7\0OLAPSYS\35\0ALL$OLAP2"..., 2064) = 2064
    read(9, "TTR_USES\376\377\4\0\303\5V\v\376\377\4\0VIEW\7\0xl\3\f\2\n"..., 1958) = 1958
    read(9, "\3\v\0\0\6\0\0\0\0\0\2\n\23\7\0xn\n\24\25\10'\23\0002008-03-"..., 2064) = 779
    write(7, "ONYM\7\0xl\3\f\2\t9\7\0xl\3\f\2\t9\23\0002008-03-"..., 4096) = 4096
    write(7, "008-03-12:01:09:02\5\0VALID\1\0N\1\0N\1"..., 28672) = 28672
    
    /* 以上可以看到exp进程首先了累计(accumulates)读取了32k左右的数据到缓存中,之后以2个write调用分别写出4096和28672 bytes
        的数据,也就是在读取32k数据后全部写出再依次循环,不同于上面的累计读取8k然后写出8k
    */
    
    /* 对比pmap报告可以发现内存使用也发生了变化 */
    
    00002b9f6e034000     708     256     256 rwx--  libnnz10.so
    00002b9f6e0e5000       4       4       4 rwx--    [ anon ]
    00002b9f6e103000     432     212     212 rwx--    [ anon ]
    00002b9f6e16f000     400       8       0 r-x--  timezlrg.dat
    00002b9f6e1f0000      40      28       0 r-x--  libnss_files-2.5.so
    
    /* 相对应的是exp进程的匿名块anon(00002b9f6e103000     432     212     212 rwx--    [ anon ])部分rss和Dirty,
        由原来的164k增长到了212k,增长了48k
    */
    
    [maclean@rh2 test]$ strace -o exp3.trace exp maclean/maclean file=tv.dmp tables=tv direct=y recordlength=65535
    
    Export: Release 10.2.0.4.0 - Production on Mon Nov 8 17:53:25 2010
    Copyright (c) 1982, 2007, Oracle.  All rights reserved.
    Connected to: Oracle Database 10g Enterprise Edition Release 10.2.0.4.0 - 64bit Production
    With the Partitioning, OLAP, Data Mining and Real Application Testing options
    Export done in US7ASCII character set and UTF8 NCHAR character set
    server uses ZHS16GBK character set (possible charset conversion)
    
    About to export specified tables via Direct Path ...
    . . exporting table                             TV    6602624 rows exported
    Export terminated successfully without warnings.
    
    /* 以65535 recordlength导出的strace 记录 */
    
    read(9, "\7\333\0\0\6\0\0\0\0\0\10\377\377\0\0MADMIN\21\0SYS_IOT_T"..., 2064) = 2011
    read(9, "\7\333\0\0\6\0\0\0\0\00010-09-29:18:14:08\5\0VAL"..., 2064) = 2064
    read(9, "4:09\5\0VALID\1\0N\1\0N\1\0N\3\0SYS\23\0AQ$AQ"..., 1958) = 1958
    read(9, "\7\333\0\0\6\0\0\0\0\0\4\0\303\6 b\5\0INDEX\7\0xn\t\36\17!0"..., 2064) = 2064
    read(9, ":21\5\0VALID\1\0N\1\0N\1\0N\3\0SYS\4\0HR11\376\377"..., 1958) = 1958
    read(9, "\7\333\0\0\6\0\0\0\0\0J$\4\0P101\4\0\303\6!>\4\0\303\6\"9\17\0"..., 2064) = 2064
    read(9, "P101\4\0\303\6!O\4\0\303\6\">\17\0INDEX PARTITIO"..., 1958) = 1958
    read(9, "\7\333\0\0\6\0\0\0\0\0I1CCOL$\4\0P101\4\0\303\6!a\4\0\303"..., 2064) = 2064
    read(9, ":44\5\0VALID\1\0N\1\0N\1\0N\3\0SYS\16\0WRH$_P"..., 1958) = 1958
    read(9, "\7\333\0\0\6\0\0\0\0\0N_HISTORY_PK\31\0WRH$_ACT"..., 2064) = 2064
    read(9, "SQLSTAT_PK\31\0WRH$_SQLSTA_14284528"..., 1958) = 1958
    read(9, "\7\333\0\0\6\0\0\0\0\0\0002010-10-18:20:48:28\5\0"..., 2064) = 2064
    read(9, ";\f\23\0002010-10-20:19:58:11\5\0VALID\1\0"..., 1958) = 1958
    read(9, "\7\333\0\0\6\0\0\0\0\0RT$\376\377\4\0\303\6$W\376\377\5\0TABLE\7\0"..., 2064) = 2064
    read(9, "38C00004$$\376\377\4\0\303\6%(\4\0\303\6%(\3\0LOB\7\0x"..., 1958) = 1958
    read(9, "\7\333\0\0\6\0\0\0\0\0\6%G\376\377\5\0TABLE\7\0xn\n\24\25\10\34\7"..., 2064) = 2064
    read(9, "VALID\1\0N\1\0N\1\0N\3\0SYS\30\0GV_OLAPI_SE"..., 1958) = 1958
    read(9, "\7\333\0\0\6\0\0\0\0\0\1\0N\1\0N\3\0SYS\31\0OLAPI_MEM"..., 2064) = 2064
    read(9, "n\n\24\25\t\n\7\0xn\n\24\25\t\n\23\0002010-10-20:20:0"..., 1958) = 1958
    read(9, "\7\333\0\0\6\0\0\0\0\0\4\0TYPE\7\0xn\n\24\25\t\v\7\0xn\n\24\25"..., 2064) = 2064
    read(9, "\16\23\0002010-10-20:20:08:12\5\0VALID\1\0N"..., 1958) = 1958
    read(9, "\7\333\0\0\6\0\0\0\0\0\7\0xn\n\24\25\t\25\23\0002010-10-20:"..., 2064) = 2064
    read(9, "ITIONSTRUCT\376\377\4\0\303\6(\4\376\377\4\0TYPE\7\0xn\n"..., 1958) = 1958
    read(9, "\7\333\0\0\6\0\0\0\0\0\4\0VIEW\7\0xn\n\24\25\t\27\7\0xn\n\24\25"..., 2064) = 2064
    read(9, " PARTITION\7\0xn\v\7\0238\10\7\0xn\v\7\0238\10\23\00020"..., 1958) = 1958
    read(9, "\7\333\0\0\6\0\0\0\0\0-11-07:18:55:08\5\0VALID"..., 2064) = 2064
    read(9, "ITION\7\0xn\v\7\0238\n\7\0xn\v\7\0238\n\23\0002010-11"..., 1958) = 1958
    read(9, "\7\333\0\0\6\0\0\0\0\000010-11-07:22:52:09\5\0VA"..., 2064) = 2064
    read(9, "-11-07:22:52:10\5\0VALID\1\0N\1\0N\1\0N\6"..., 1958) = 1958
    read(9, "\7\333\0\0\6\0\0\0\0\0T_SOO_BUFFER_BUSY\376\377\4\0\303"..., 2064) = 2064
    read(9, "\0xn\n\36\27\5\33\7\0xn\n\37\27\6\5\23\0002010-10-23:01"..., 1958) = 1958
    read(9, "\7\333\0\0\6\0\0\0\0\0\6+ \17\0TABLE PARTITION\7\0"..., 2064) = 2064
    read(9, "09\5\0VALID\1\0N\1\0N\1\0N\3\0SYS\27\0WRH$_DB"..., 1477) = 1477
    write(7, "0-09-29:17:56:12\5\0VALID\1\0N\1\0N\1\0N"..., 4096) = 4096
    write(7, "05465\376\377\4\0\303\6\37\\\4\0\303\6\37\\\5\0INDEX\7\0xn\t\35"..., 61440) = 61440
    
    /* 这里exp首先累计(accumulates)读取了65536 bytes的数据到缓存中,然后以2次write写出这些记录到导出文件中
       换而言之可以把recordlength看做direct patch时的buffer size
    */
    

    那么recordlength是如何影响exp的效率的呢?由以上演示可知在使用direct直接路径读取方式时,recordlength并不影响读取(read),不管我们设置如何的recordlength,exp进程所需做的read总工作量都是一样的。区别在于write的次数和单次写出的数据量,以不设置recordlength为例,其写出8192字节数据需要做2次的write,则当dump文件为600MB时需要写出153600次;而设置recordlength为65535时,其写出(4096+61440)=65536也仅需要做2次write call,当dump文件为600MB时仅需要写出19200次。可知当使用更大的recordlength时可以有效减少exp作业所需的CPU时间和实际IO次数,以极大地加速导出速度;表现到IO层的话,就是用户可以显示地使用iostat等工具看到在导出阶段的写出IO大幅上升。使用recordlength的直接代价是exp进程会消耗使用更多的内存(一般在100~200k左右),以现在的眼光看来这点内存无关紧要。

    需要注意的是recordlength现在存在一个最大值(maximum)为65535,设置超过65536的recordlength,exp程序都会返回如:Note: RECORDLENGTH=65536 truncated to 65535的信息;早期版本(734 or 8i)中不存在这个限制,也说明了exp的开发人员逐渐意识到大于65535的 recordlength无益于加速导出。

    metalink文档[ID 134966.1]指出了如何判断recordlength的默认值:

    Problem Description
    ——————-
    You want to export the entire database and move it to a different platform.
    The RECORDLENGTH parameter must be specified during the export since each
    platform has a different default.
    How do you determine the default RECORDLENGTH value for each platform?
    Solution Description
    ——————–
    Look for the BUFSIZ-Parameter in the File /usr/include/stdio.h file to determine
    the default size of the output record length.
    If no value is specified for the BUFSIZ parameter then a default of 512 bytes
    will be used.
    Explanation
    ———–
    If the RECORDLENGTH parameter is not explicitly set on EXP/IMP, ORACLE will use the
    value specified for BUFSIZ in the /usr/include/stdio.h file to determine the
    size of it’s output record length.
    The BUFFER parameter applies ONLY to conventional path Export. It has no effect on a direct path Export. This BUFFER parameter specifies the size (in bytes) of the buffer used to fetch rows. It determines the maximum number of rows in an array, fetched by Export. For direct path Export, use the RECORDLENGTH parameter to specify the size of the buffer that Export uses for writing to the export file.

    The RECORDLENGTH parameter specifies the length (in bytes) of the file record. You can use this parameter to specify the size of the Export I/O buffer (highest value is 64 kb). Changing the RECORDLENGTH parameter affects only the size of data that accumulates before writing to disk. It does not affect the operating system file block size. If you do not define this parameter, it defaults to your platform-dependent value for BUFSIZ (1024 bytes in most cases).

    BUFSIZ本身是UNIX/LINUX系统中控制I/O buffersize的参数,有兴趣研究的话可以参考著名的apue书(W.Richard Stevens的<Advanced Programming in the UNIX Environment>,这本书可以做任何人的Unix C启蒙书:

    The value of BUFSIZ is chosen on each system so as to make stream I/O efficient. So it is a good idea to use BUFSIZ as the size for the buffer when you call setvbuf. Actually, you can get an even better value to use for the buffer size by means of the fstat system call: it is found in the st_blksize field of the file attributes.Sometimes people also use BUFSIZ as the allocation size of buffers used for related purposes, such as strings used to receive a line of input with fgets (see section 12.8 Character Input). There is no particular reason to use BUFSIZ for this instead of any other integer, except that it might lead to doing I/O in chunks of an efficient size.

    Oracle网络TNS协议介绍(revised)

    在开发源工具解决Oracle中的问题时,必须了解TNS协议。在努力理解TNS协议的时候,Oracle JDBC驱动程序(classes12.zip)会是一个很有用的资源

    TNS头

    每个TNS包都有一个8字节的包头。包最前面的两个字节用来表示包的长度–不包括包头的大小。和所有的值一样,大小是大端字节的方式存储的。如果进行了校验,那么校验和会被存放在下一个字(WORD)内–默认情况下会对校验和进行校验,该字(WORD)的值为0x0000。下面的一个字节用来表示包的类型–例如,最常见的类型如下所示:

    Connect packet Type        1
    Accept packet    Type       2
    Ack  packet          Type      3
    Refuse Packet     Type      4
    Redirect Packet    Type   5
    Data   Packet         Type    6
    NULL Packet          Type    7
    Abort  Packet          Type   9
    Resend    Packet       Type 11
    Marker   Packet         Type 12
    Attention Packet       Type 13
    Control   Packet        Type 14

    要连接Oracle的时候,在TNS级,客户机向服务器发送一个链接包(类型1),这个包会指定客户将要访问的服务器名称。假定Listener知道这样的服务,那么接下来有两种可能:Listener可能会发送一个接收包(类型2)或者它可能用一个重定向包(类型5)将客户机指定向到另一个端口。如果出现的是前一种情况,那么客户机将尝试进行身份验证。如果出现的是后一种情况,那么客户机会向自己被重定向的端口发送一个连接包并请求访问该服务。如果一切顺利的话,服务器会发出一个接收包并开始进行身份验证。所有的身份验证包都是类型为6的数据包。

    如果Listener不知道客户机要求访问那个服务,那么它就会发送一个拒绝包–类型4。一旦通过身份验证,查询包和结果包都是数据包。偶尔您会看到类型为12(oxoC的包)–这是用来中断的标记包。例如,如果服务器希望客户机停止发送数据,那么它会向客户机发送一个标记包。

    接下来继续介绍TNS包头的细节,下面的一个字节是包头标志位(header flag)。一般这些包头标志位是不使用的,不过在10g中客户机可能会将它的值设定为0x04。

    最后的两个字节构成一个字(WORD),他用来存放头校验和–在默认情况下不使用这个字并将其设为0x000:

    WORD   00 00  Pocket Size
    WORD   00 00  Packet Checksum
    Byte     00  Packet Type
    Byte     00   Flags
    Word     00 00 Header Checksum

    在对包进行深入研究前,观察一下拒绝包(类型4)应该会有所帮助。拒绝包表示某种错误–例如,一个因“用户名/密码无效”而被拒绝登陆的错误–即ORA-01017。根绝这些错误,第54个字节指出了问题所在:A3代表无效的密码,a2表明没有这样的用户。很明显,即使从拒绝包中也可以得到可能有用的信息。

    发现这篇文章被网友转载了:地址;而且因为163 blog的权重比这里高导致原帖变成了”转帖”,真是很令人头痛的事情,
    转载请注明出处:www.askmac.cn  谢谢!

    logfile switch causes incremental checkpoint?

    不少Oracle的初学者都会因为checkpoint这个知识点而头痛,绝大多数Oracle文档对完全检查点和增量检查点的描述又都略显朦胧;譬如在线日志的切换引起的是完全检查点还是增量检查点这个问题,就有不少的争论。实际上增量检查点与完全检查点有一个显著的区别:完全检查点发生时控制文件和数据文件头中的checkpoint scn都会被更新,而增量检查点发生时只有控制文件中的checkpoint scn更新;
    我们可以通过以下演示证明日志切换引发的到底是何种检查点?:

    SQL> select checkpoint_change# from v$datafile_header where status='ONLINE';
    CHECKPOINT_CHANGE#
    ------------------
               1665476
               1665476
               1665476
               1665476
               1665476
               1665476
    6 rows selected.
    
    SQL> alter system checkpoint;
    System altered.
    
    SQL> select checkpoint_change# from v$datafile_header where status='ONLINE';
    CHECKPOINT_CHANGE#
    
    ------------------
               1697131
               1697131
               1697131
               1697131
               1697131
               1697131
    6 rows selected.
    
    /* 手动执行checkpoint,数据文件头的checkpoint scn立即更新了 */
    
    SQL> alter system flush buffer_cache;
    System altered.
    
    SQL> select checkpoint_change# from v$datafile_header where status='ONLINE';
    CHECKPOINT_CHANGE#
    ------------------
               1697131
               1697131
               1697131
               1697131
               1697131
               1697131
    6 rows selected.
    
    /* 单纯flush buffer cache冲刷数据库高速缓存不会更新数据文件头的checkpoint scn */
    
    SQL> alter system set log_checkpoints_to_alert=true;
    System altered.
    
    SQL> alter system set log_checkpoint_timeout=20;
    System altered.
    
    /* 设置log_checkpoint_timeout为20s,频繁引发增量检查点 */
    
    alert log:
    Wed Nov  3 20:24:49 2010
    Incremental checkpoint up to RBA [0x3d.dff1.0], current log tail at RBA [0x3d.dff6.0]
    Wed Nov  3 20:25:07 2010
    Incremental checkpoint up to RBA [0x3d.dff7.0], current log tail at RBA [0x3d.dffc.0]
    Wed Nov  3 20:25:25 2010
    Incremental checkpoint up to RBA [0x3d.dffd.0], current log tail at RBA [0x3d.e002.0]
    Wed Nov  3 20:25:43 2010
    Incremental checkpoint up to RBA [0x3d.e003.0], current log tail at RBA [0x3d.e008.0]
    Wed Nov  3 20:26:01 2010
    Incremental checkpoint up to RBA [0x3d.e009.0], current log tail at RBA [0x3d.e00e.0]
    
    SQL> set time on;
    
    20:26:38 SQL> select checkpoint_change# from v$datafile_header where status='ONLINE';
    CHECKPOINT_CHANGE#
    ------------------
               1697131
               1697131
               1697131
               1697131
               1697131
               1697131
    
    6 rows selected.
    
    /* 可以看到增量检查点并不会引起数据文件头的checkpoint scn 被更新 */
    
    20:26:43 SQL>  alter system set log_checkpoint_timeout=1800;
    System altered.
    
    /* 那么日志文件切换就会引起数据文件头的checkpoint scn被更新吗?*/
    
    20:28:10 SQL> alter system switch logfile;
    System altered.
    
    20:29:16 SQL> select checkpoint_change# from v$datafile_header where status='ONLINE';
    CHECKPOINT_CHANGE#
    ------------------
               1697131
               1697131
               1697131
               1697131
               1697131
               1697131
    6 rows selected.
    
    /* logfile switch 日志文件切换引起的是一种slow慢的完全检查点,它不同于alter system checkpoint(ASC),
       ASC要求的脏块写出和控制文件及数据文件头更新时要立即完成的,也就是说当alter system checkpoint语句返回"System altered."
       后以上工作都已经完成了;而alter system switch logfile或者自然的日志切换引发的是一种慢的完全检查点,
       它在返回"System altered"时不要求写脏块等工作必须已经完成
    */
    
    /* 我们可以用冲刷高速缓存的方式保证脏块写出的工作被督促完成 */
    
    20:33:39 SQL> alter system flush buffer_cache;
    System altered.
    
    20:33:45 SQL> select checkpoint_change# from v$datafile_header where status='ONLINE';
    CHECKPOINT_CHANGE#
    ------------------
               1697544
               1697544
               1697544
               1697544
               1697544
               1697544
    
    6 rows selected.
    
    /* 虽然日志切换所引发的slow checkpoint(慢的检查点)并无立即完成的要求,但也并非全无限制;
       当某次日志切换由1号日志组切换到2号日志组时,
       将引发一个slow checkpoint,之后日志连续切换又要切到1号日志组时要求之前的那个slow checkpoint在切换前必须完成
    */
    
    20:41:35 SQL> set timing on;
    
    20:42:02 SQL>  select * from v$log;
        GROUP#    THREAD#  SEQUENCE#      BYTES    MEMBERS ARC STATUS           FIRST_CHANGE# FIRST_TIME
    ---------- ---------- ---------- ---------- ---------- --- ---------------- ------------- -------------------
             1          1         67   52428800          2 YES INACTIVE               1698288 2010-11-03 20:41:19
             2          1         68   52428800          2 YES INACTIVE               1698292 2010-11-03 20:41:21
             3          1         69   52428800          2 NO  CURRENT                1698302 2010-11-03 20:41:35
    Elapsed: 00:00:00.00
    
    20:42:17 SQL> delete tv;
    51134 rows deleted.
    Elapsed: 00:00:01.68
    
    20:42:34 SQL> commit;
    Commit complete.
    Elapsed: 00:00:00.00
    
    20:42:36 SQL> alter system switch logfile;
    System altered.
    Elapsed: 00:00:00.01
    
    20:42:40 SQL> alter system switch logfile;
    System altered.
    Elapsed: 00:00:00.01
    
    20:42:43 SQL> alter system switch logfile;
    System altered.
    Elapsed: 00:00:02.00
    
    20:45:28 SQL>  select checkpoint_change# from v$datafile_header where status='ONLINE';
    CHECKPOINT_CHANGE#
    ------------------
               1700686
               1700686
               1700686
               1700686
               1700686
               1700686
    6 rows selected.
    Elapsed: 00:00:00.00
    
    alter.log告警日志中的内容:
    
    Wed Nov  3 20:42:40 2010
    Beginning log switch checkpoint up to RBA [0x46.2.10], SCN: 1700686
    ...........................
    Wed Nov  3 20:42:45 2010
    Thread 1 cannot allocate new log, sequence 72
    Checkpoint not complete
    ....................
    Completed checkpoint up to RBA [0x46.2.10], SCN: 1700686
    
    /* 最近一次的日志切换耗费2s,在告警日志中可以看到此次slow checkpoint的相关记录 */
    

    Know more about RAC GES STATISTICS

    GES 全称为Global Enqueue Services是RAC中重要的全局队列锁服务,V$GES_STATISTICS 动态性能视图汇聚了主要的GES STATISTICS 统计信息。为了更好地理解GES STATISTICS ,我们可以通过下表理解这些统计项的含义:


    V$GES_STATISTICS Reference (10.2.0.1.0)


    0 messages sent directly         


    Incremented when any process successfully sends a message to a remote instance without being blocked and without flow control.


    1 messages flow controlled                 


    Incremented when any process could not send a message directly because there were not enough tickets available.


    2 messages sent indirectly


    Incremented when any process is asked to flow-control the message (i.e. a process tried to send a message indirectly, even if a ticket was available). This can also be incremented when previous message to the same target node had failed or a GCS/GES operation is being frozen.


    3 messages received logical


    When LMS receives a GCS/GES message from remote or local client, this statistic is incremented.


    61 messages received actual


    When LMS receives a message from a remote instance, this is incremented. A single actual message can contain multiple logical messages. Note, that when remote messages are queued, because they are flow controlled or they are indirectly / intentionally queued, the LMS process tries to send them in batch instead of flushing them individually.


    4 flow control messages sent

    5 flow control messages received


    Messages flow controlled due to lack of ticket.


    6 gcs msgs received

    7 gcs msgs process time(ms)

    8 ges msgs received

    9 ges process time(ms)


    When LMS receives a message, and if the message is related to either GCS (Global Cache Service) or GES (Global Enqueue Service) activity, it is incremented. After a GCS/GES message is processed, the process (typically LMD or LMS) updates the following statistics.


    • gcs msgs received
    • gcs msgs process time(ms)
    • ges msgs received
    • ges msgs process time(ms)


    10 msgs causing lmd to send msgs 

    11 lmd msg send time(ms)

    65 msgs causing lms to send msgs 

    66 lms msg send time(ms)


    Incremented when the LMD/LMS processes a GCS/GES message and it causes LMD/LMS to send one or more messages. For example, if LMS receives a message, and as part of processing it sends four more messages, the statistic will be incremented by 1, not 4. In order to get the exact number of messages sent by LMS, the session statistic ‘gcs messages sent’ and ‘ges messages sent’ needs to be retrieved for the session running LMS (from V$SESSTAT).


    12 gcs side channel msgs actual

    13 gcs side channel msgs logical


    ‘side channel msgs logical’ indicates the number of blocks shipped from this node to other nodes. ‘side channel msgs actual’ indicates the actual number of messages sent to other nodes. When CR blocks or current blocks are sent to a remote node, the sender actually sends another reliable message to the requestor, because the CR block or current block being shipped could be lost. For example, a node sends 100 CR blocks to another node (logical number of messages). The sender node then may send a message saying ‘I’ve sent 100 blocks’ in a single message (actual number of messages). The init.ora parameter ‘_side_channel_batch_size’ defines the number of side channel messages to be sent in a single message.  With reliable IPC technology such as RSM and HyperFabric, we do not need side channel messages, and this value should be 0. With non-reliable IPC technology like UDP, these should be increased.


    14 gcs pings refused


    Incremented when the master node sends a BAST to a holder node, and the holder node is not able to service the BAST for some reason (typically because the block is not present or the ping queue is full).


    15 gcs writes refused


    Same as above, except that this is for Writes. In RAC if the blocks are globally dirty the writes are mediated by the GCS.


    16 gcs error msgs


    Certain race conditions in the GCS this statistic to be updated. It usually involves sending some extra messages to resolve the race through the use of error messages.


    17 gcs out-of-order msgs


    With direct sends, it is possible for two messages, which are sent from the same instance, to be received out-of-order at the master node. This statistic is updated whenever that happens.


    18 gcs immediate (null) converts


    Incremented when NULL lock can be granted immediately


    19 gcs immediate cr (null) converts


    Incremented when NULL lock for CR request can be granted immediately


    20 gcs immediate (compatible) converts


    Incremented when shared lock can be granted immediately


    21 gcs immediate cr (compatible) converts


    Incremented when shared lock for CR request can be granted immediately


    22 gcs blocked converts


    Incremented when the lock cannot be granted immediately. The lock is on the head of the convert queue.


    23 gcs queued converts


    Incremented when the lock cannot be granted immediately, and there is a conflicting lock in the convert queue ahead of this lock.


    24 gcs blocked cr converts


    Incremented when a CR request cannot be granted a lock because the lock is already being converted or the lock is in exclusive mode


    25 gcs compatible basts


    Number of BAST’s sent to holder node of a compatible lock.


    26 gcs compatible cr basts (local)


    CR request can be granted a lock, and BAST is sent to holder node. The lock is in local role.


    60 gcs compatible cr basts (global)


    This is incremented when the lock request is compatible but we can’t read from
    disk because the block is globally dirty.


    27 gcs cr basts to PIs


    CR request is sent to an instance that has a PI buffer that satisfies this CR request.


    28 dynamically allocated gcs resources

    29 dynamically allocated gcs shadows


    Number of gcs resources / shadows dynamically allocated after the startup of instance. We should not see these increasing at all.  _gcs_resources and _gcs_shadows could be used to change the default number of these resources to avoid dynamic allocation, but we should treat it as a bug (the default should be enough or it could be memory leak.).


    30 gcs recovery claim msgs


    Number of recovery claim messages processed by this instance.


    31 gcs indirect ast


    AST is sent to LMS instead of foreground process.


    32 gcs dbwr write request msgs

    33 gcs dbwr flush pi msgs

    34 gcs lms write request msgs

    35 gcs lms flush pi msgs

    36 gcs write notification msgs


    Messages related to flushing dirty XCUR / PI buffers. To flush PI buffers, request master node to write the most recent copy of the block in the global cache, which is ‘write request msgs’. Once the most recent copy of the block in the global cache is written to disk, PI buffers in the global cache can be purged, which is ‘flush pi msgs’. Once the most recent copy is written to disk, ‘write notification’ message is sent to the master node.


    37 gcs retry convert request


    Convert request had to be retried due to some race conditions.


    38 gcs regular cr


    CR for data blocks


    39 gcs undo cr


    CR for undo blocks


    40 gcs assume no cvt


    Assume was processed when the convert q is empty.


    41 gcs assume cvt


    Assume was processed when the convert q is non-empty.


    42 broadcast msgs on commit(actual)


    MCPD=0, number of messages sent to update the SCN.


    43 broadcast msgs on commit(logical)


    Same as 42, but logical (because the update may have been piggybacked).


    44 broadcast msgs on commit(wasted)


    Update SCN mesage is sent, but it is potentially a waste because receiver may have already updated the SCN.


    45 acks for commit broadcast(actual)

    46 acks for commit broadcast(logical)


    Same as 42, 43 except that it applies to the receiving instance.


    47 false posts waiting for scn acks


    We posted LGWR because we thought MCPD broadcast completed, but it didn’t.


    48 gcs forward cr to pinged instance


    CR request is forwarded to the instance that is currently converting the GCS resource


    49 gcs cr serve without current lock


    CR block is served by the instance that does not have the current lock.


    50 msgs sent queued

    51 msgs sent queue time (ms)


    Number of logical messages sent through send queue and their queuing time. Queuing time for queued messages: ‘msgs sent queue time (ms)’ / ‘msgs sent queued’  à Average message queuing time for flow controlled or indirectly sent messages. Note: this is calculated at ‘kjct’ layer (GCS/GES communication layer).


    52 msgs sent queued on ksxp

    53 msgs sent queue time on ksxp (ms)


    Number of messages queued, and queuing time on ksxp layer. This includes all types of GCS/GES messages sent by any Oracle processes (foreground and background processes). Note: ‘msgs sent queued’ is a statistic from the kjct layer where we know if the messages are directly sent or indirectly sent.


    54 msgs received queue time (ms)

    55 msgs received queued


    Elapsed time that a message is actually received until it is processed. Number of messages received  (logical). The ratio ‘msgs received queue time (ms)’ / ‘msgs received queued’ gives us the average queuing time between message arrival and start processing.


    56 implicit batch messages sent

    57 implicit batch messages received


    Number of messages sent/received that are batched implicitly. Note: messages that are queued because of flow control or because of indirect messages, can be batched.


    58 gcs refuse xid


    Number of lock request received but refused to process by this instance, because index split is in progress (new in Oracle9i Release 2)


    59 gcs ast xid


    Number of lock request canceled because of index split


    62 process batch messages sent

    63 process batch messages received


    Number of messages sent/received in batch.  When LMS receives multiple remote messages at a time, it processes all of them first, and then sends messages in batch as a result, instead of sending the result for each request individually.


    64 messages sent pbatched


    This is the number of messages being sent through process batching. This is the logical number whereas “process batch messages sent” is the actual number of messages sent out. Process batching in 10g is used for multi-block read, newing, receiver direct send (LMD0, LMS*, LMON) and fusion write (DBW*).


    67 global posts requested


    AQ requested that a global post be delivered to another instance


    68 global posts dropped


    Post was dropped because there was no buffer space.


    69 global posts queued


    A post was queued to be sent to another instance


    70 global posts sent


    A post was actually sent to another instance


    71 global posts queue time


    Time difference between enqueuing and sending the post.


    72 messages sent not implicit batched


    This is the number of indirect sent messages not get any batching done from the send proxies due to various reason. For example, the message is big enough or is defined as non-batch type.


    73 messages queue sent actual


    Actual number of messages sent indirectly by send proxies.


    74 messages queue sent logical


    Logical number of messages sent indirectly by send proxies including the number of embedded message batched either through process batching or batching done in send proxies.


    实际V$GES_STATISTICS的信息来源于X$KJISFT内部视图

    [转]如何阅读systemstate dump

    转自老白的<oracle rac 日记>一书,

    dump systemstate产生的跟踪文件包含了系统中所有进程的进程状态等信息。每个进程对应跟踪文件中的一段内容,反映该进程的状态信息,包括进程信息,会话信息,enqueues信息(主要是lock的信息),缓冲区的信息和该进程在SGA区中持有的(held)对象的状态等信息。dump systemstate产生的跟踪文件是从dump那一刻开始到dump任务完成之间一段事件内的系统内所有进程的信息。

    那么通常在什么情况下使用systemstate比较合适呢?

    Oracle推荐的使用systemstate事件的几种情况是:

    数据库hang住了

    数据库很慢

    进程正在hang

    数据库出现某些错误

    资源争用


    dump systemstate的语法为:

    ALTER SESSION SET EVENTS ‘immediate trace name systemstate level 10’;

    也可以使用ORADEBUG实现这个功能:

    sqlplus -prelim / as sysdba

    oradebug setmypid

    oradebug unlimit;

    oradebug dump systemstate 10

    如果希望在数据库发生某种错误时调用systemstate事件,可以在参数文件(spfile或者pfile)中设置event参数,

    例如,当系统发生死锁(出现ORA-00060错误)时dump systemstate:

    event = “60 trace name systemstate level 10”


    LEVEL参数:

    10    Dump all processes (IGN state)

    5     Level 4 + Dump all processes involved in wait chains (NLEAF state)

    4     Level 3 + Dump leaf nodes (blockers) in wait chains (LEAF,LEAF_NW,IGN_DMP state)

    3     Level 2 + Dump only processes thought to be in a hang (IN_HANG state)

    1-2   Only HANGANALYZE output, no process dump at all


    如果Level过大的话会产生大量的跟踪文件并影响系统的I/O性能,建议不要采用3级以上的跟踪。Hanganalyze报告会分作许多片断,会话片断信息总是由一个header详尽描述被提取的的会话信息。


    一般来说,一份systemstate dump中包含了以下内容:

    dump header文件头

    process dump dump时所有的process的dump信息,每个process一个专门的章节。

    call dump在process dump中,包含call dump

    session dump每个process中,都有1个或多个(MTS时)session dump

    enqueue dump

    buffer dump在session dump中可能包含buffer dump


    在阅读systemstate dump时,一般首先使用ASS工具来进行分析。ASS是oracle工程师编写的一个AWK脚本,用于分析systemstate dump文件,找出dump中可能存在问题的地方。通过ASS的输出结果,我们就可以发现一些blocker的线索,这些线索就是我们重点要查看的地方。


    我们可以通过搜索SO的地址信息来定位某个SO,找到后分析这个SO的信息,并且通过PARENT SO的地址找到其PARENT,建立这些SO的关系图。比如我们找到一个SESSION的SO,就可以看看这个session属于哪个process,这个session正在执行的sql是什么,等等。通过这种分析,就把可能存在问题的SO及关联的SO全部找出来,这样就为进一步分析提供了素材。


    1、标准的state object header(SO)

    state object header中包含了一些基本的信息,比如:

    SO: c00004ti4jierj, type: 2. owner: 0000000000, flag: init/-/-/0x00

    其中SO是state object的号码;

    type表示state object的类别;

    TYPE: state object的已知类别:

    2 process(进程)

    3 call

    4 session(会话信息)

    5 enqueue(锁信息)

    6 file infomation block(文件信息块,每个FIB标识一个文件)

    11 broadcast handle(广播消息句柄)

    12 KSV slave class state

    13 ksvslvm

    16 osp req holder(会话执行os操作的holder)

    18 enqueue resource detail(锁资源详细资料)

    19 ges message(ges消息)

    20 namespace [ksxp] key

    24 buffer [db buffer]

    36 dml lock

    37 temp table lock(临时表锁)

    39 list of blocks(用于block cleanout的块列表清单)

    40 transaction(事务)

    41 dummy

    44 sort segment handle(排序段句柄)

    50 row cache enqueue

    52 user lock

    53 library cache lock

    54 library cache pin

    55 library cache load lock

    59 cursor enqueue

    61 process queue

    62 queue reference

    75 queue monitor sob


    owner是这个SO的父节点(如果为0,说明是最顶层的SO);flag表示状态,值有以下三种:

    kssoinit;state object被初始化了

    kssoflst;state object在freelist上

    kssofcln;state object已经被pmon释放了。


    State object header的数据结构如下:

    struct kssob {

    unsigned char       kssobtyp; /* state object的类别*/

    unsigned char       kssobflg; /* flags */

    unsigned char       kssobdelstage;

    struct kssob *       kssobown; /*拥有者的SO指针*/

    kgglk                   kssoblnk; /*在父对象成员链中的指针*/

    }

    2、processstate dump(ksupr)

    processstate dump转储了进程的状态,从这些信息中我们可以了解进程的基本属性以及进程的状态。

    在阅读processstate dump时,我们主要关注的进程的标识(FLAG),从中也可以知道进程的类别。从”(latch info)”中可以看到进程等待latch的情况,这也有助于了解进程故障的原因。另外,进程的OS信息对于进一步了解进程情况也是很有帮助的。

    实际上,x$ksupr包含了进程的信息,通过该内存视图可以更进一步了解processstate dump的内容。

    ADDR    地址

    INDX    序号

    INST_ID实例ID

    KSSPAFLG   state object的状态:

    KSSOINIT 0x01 // state object initialized

    KSSOFLST 0x02 // state object is on free list

    KSSOFCLN 0x04 // state object freed by PMON(for debugging)

    KSSPAOWN  该SO的OWNER,如果自己是顶层的SO,那么owner为0

    KSUPRFLG   该process的状态:

    KSUPDEAD 0x01 process is dead and should be cleaned up

    KSUPDSYS 0x02 detached,system process

    KSUPDFAT 0x04 detached,fatal(system) process

    KSUPDCLN 0x08 process is cleanup(pmon)

    KSUPDSMN 0x10 process is smon

    KSUPDPSU 0x20 pseudo process

    KSUPDMSS 0x40 muti-stated server

    KSUPDDPC 0x80 dispatcher process

    KSUPRSER   进程的序号(SERIAL NO)

    KSUPRIOC

    KSLLALAQ   持有的latch

    KSLLAWAT   正在等待的latch

    KSLLAWHY  latch请求的上下文(用于debug)

    KSLLAWER  latch请求的位置(用于debug)

    KSLLASPN   本进程正在spin的latch

    KSLLALOW  所持有latch级别的位图(0~9级)

    KSLLAPSC   进程发出的POST消息的计数

    KSLLAPRC   进程收到的POST消息的计数

    KSLLAPRV   收到的最后一个POST的LOC ID,参考图中的①

    KSLLAPSN   最后一个发送POST的LOC ID,参考图中的②

    KSLLID1R    RESOURCE ID的第一部分

    KSLLID2R    RESOURCE ID的第二部分

    KSLLRTYP   RESOURCE TYPE+RESOURCE FLAG

    KSLLRMTY  RESOURCE MANAGE的类型:

    KRMENQ    0x01 enqueues

    KRMLATCH  0x02 latches

    KRMLIBCALK 0x03 library cache locks

    KRMBUFLK  0x04 buffer locks

    KSLLARPO   最后一个发送消息给这个进程的OS进程

    KSLLASPO   这个进程最后一个发送信息过去的OS进程

    KSUPRPID    OS进程号

    KSUPRWID   等待事件的ID

    KSUPRUNM  OS用户名

    KSUPRMNM 用户的机器名

    KSUPRPNM  用户程序名

    KSUPRTID    用户终端名

    KSSRCOBJ   STATE OBJECT RECOVERY数据中的正在被操作的对象

    KSSRCFRE   STATE OBJECT RECOVERY数据中的FREELIST的地址

    KSSRCSRC   STATE OBJECT RECOVERY数据中的SOURCE PARENT

    KSSRCDST   STATE OBJECT RECOVERY数据中的DESTINATION PARENT

    KSASTQNX  MESSAGE STATE中的前向指针

    KSASTQPR   MESSAGE STATE中的后向指针

    KSASTRPL   MESSAGE STATE中的REPLY VALUE

    KSUPRPGP   PROCESS GROUP的名字

    KSUPRTFI    进程的trace文件名

    KSUPRPUM  PGA使用的内存

    KSUPRPNAM  KSUPRPNAM+KSUPRPRAM是pga分配内存的总和

    KSUPRPRAM

    KSUPRPFM  pga可释放的内存

    KSUPRPMM pga使用的最大内存

    3、session state object 

    会话信息中包含了大量我们所需要的信息,一般来说会话状态块是我们分析会话情况的重点。

    在会话状态信息中,flag是十分重要的,我们可以从flag中了解会话目前的情况,以及flag位图的详细信息。该会话正在执行的sql和pl/sql的SO地址可以让我们找到当前会话正在做的工作,有助于进一步

    分析。另外,会话的等待事件和历史等待事件可以让用户了解会话在现在和过去一段时间里等待的情况,如果要分析会话故障原因的话,这些资料都是十分重要的。

    flag的位图如下:

    KSUSFUSR   0x00000001   user session (as opposed to recursive session)

    KSUSFREC   0x00000002   recursive session(always internal)

    KSUSFAUD   0x00000004   audit logon/logoff,used by cleanup

    KSUSFDCO  0x00000008   disable commit/rollback from plsql

    KSUSFSYS   0x00000010   user session created by system processes

    KSUSFSGA   0x00000020   whether UGA is allocate in sga

    KSUSFLOG   0x00000040   whether user session logs on to ORACLE

    KSUSFMSS   0x00000080   user session created by multi-stated server

    KSUSFDIT    0x00000100   disable (defer) interrupt

    KSUSFCLC   0x00000200   counted for current license count decrement

    KSUSFDET   0x00000400   session has been detached

    KSUSFFEX   0x00000800   “forced exit”during shutdown normal

    KSUSFCAC   0x00001000   (cloned) session is cached

    KSUSFILS    0x00002000   default tx isolation level is serializable

    KSUSFOIL    0x00004000   override serializable for READ COMMITTED

    KSUSFIDL    0x00008000   idle session scheduler

    KSUSFSKP   0x00010000   SKIP unusable indexes maintenance

    KSUSFCDF   0x00020000   defer all deferrable constraint by default

    KSUSFCND  0x00040000   deferable constraints are immediate

    KSUSFIDT    0x00080000   session to be implicitly detached

    KSUSFTLA   0x00100000   transaction audit logged

    KSUSFJQR   0x00200000   recource checking in job q process enabled

    KSUSFMGS  0x00400000   session is migratable

    KSUSFGOD  0x00800000   migratable session need to get ownership id

    KSUSFSDS   0x01000000   suppress/enable TDSCN      computations

    KSUSFMSP   0x02000000   parent of migratable session

    KSUSFMVC  0x04000000   MV container update progress

    KSUSFNAS   0x08000000   an NLS alter session call was done

    KSUSFTRU    0x10000000  a trusted callout was performed

    KSUSFHOA   0x20000000   an HO agent was called

    KSUSFSTZ   0x40000000   an alter session set time_zone was done

    KSUSFSRF   0x80000000   summary refresh


    4、call state object

    Call state object是针对一个call的,我们查看call state object的时候一定要注意depth值,以此判断该call是用户调用还是递归调用。

    5、enqueue state object  

    从enqueue state object中,我们主要可以查看锁的类型、锁的模式以及flag。

    6、transaction dump

    Transaction dump对应的oracle内存结构是KTCXB,可以通过X$KTCXB来了解更详细的情况。

    flag的描述如下(资料来源早期版本,针对10g可能略有不同):

    1          allocated but no transaction

    2          transaction active

    4          state object no longer valid

    8          transaction about to commit/abort

    10          space management transaction

    20          recursive transaction

    40          no undo logging

    80          no change/commit,must rollback

    100        use system undo segment (0)

    200        valid undo segment assigned

    400        undo seg assigned,lock acquired

    800        change may have been made

    1000      assigned undo seg

    2000      required lock in cleanup

    4000      is a pseudo space extent

    8000      save the tx table & tx ctl block

    10000    no read-only optimize for 2pc

    20000    multiple sess attached to this tx

    40000    commit scn future set

    80000    dependent scn future set

    100000   dist call failed,force rollback

    200000   remote uncoordinated ddl tx

    400000   coordinated global tx

    800000   pdml transaction

    1000000        next must be commit or rollback

    2000000        coordinator in pdml

    4000000        disable block level recovery

    8000000        library and/or row caches dirty

    10000000      serializable transaction

    20000000      waiting for unbound transaction

    40000000      loosely coupled transaction branch

    80000000      long-running transaction


    flag2的描述如下(资料来源早期版本,针对10g可能略有不同):

    1    tx needs refresh on commit

    2    delete performed in tx

    4    concurrency check enabled

    8    insert performed

    10   dir path insert performed

    20   fast rollback on net disconnect

    40   do not commit this tx

    80   this tx made remote change

    100 all read-only optim enabled


    事务环境的结构如下:

    Struct ktcev {

    kenv             ktcevenv;

    kuba             UBA的高水位;

    kuba             ktcevucl;

    sb2        在undo高水位块中的剩余空间;

    kcbds     undo block的描述;

    kdbafr    undo段头的DBA地址;

    kturt *    指向undo seg的KTURT结构;

    }


    7、library object lock/handle

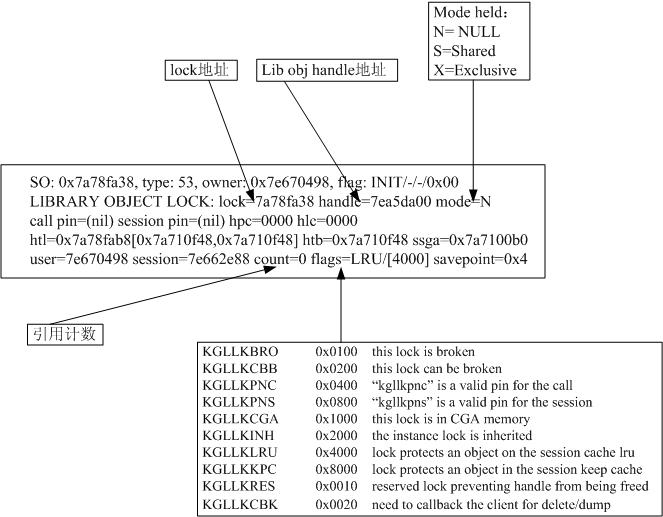
    library object lock如下:

    Flags的描述如下:

    KGLLKBRO  0x0100   this lock is broken

    KGLLKCBB   0x0200   this lock can be broken

    KGLLKPNC  0x0400   “kgllkpnc” is a valid pin for the call

    KGLLKPNS   0x0800   “kgllkpns” is a valid pin for the session

    KGLLKCGA  0x1000   this lock is in CGA memory

    KGLLKINH   0x2000   the instance lock is inherited

    KGLLKLRU   0x4000   lock protects an object on the session cache lru

    KGLLKKPC   0x8000   lock protects an object in the session keep cache

    KGLLKRES   0x0010   reserved lock preventing handle from being freed

    KGLLKCBK   0x0020   need to callback the client for delete/dump


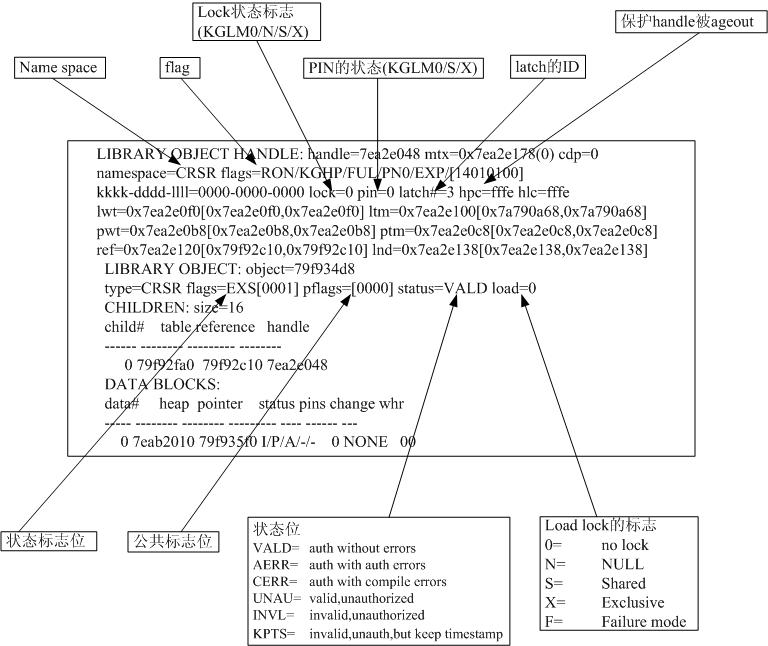
    作为library object的主体,handle的信息如图:

    其中namespace的取值包括:

    CRSR    cursor

    TABL     table/view/sequence/synonym

    BODY    body(e.g.,package body)

    TRGR    trigger

    INDX    index

    CLST     cluster

    KGLT    internal KGL testing

    PIPE      pipe

    LOB      lob

    DIR       directory

    QUEU    queue

    OBJG     replication object group

    PROP    replication propagator

    JVSC     java source

    JVRE     java resource

    ROBJ     reserved for server-side RepAPI

    REIP      replication internal package

    CPOB    context policy object

    EVNT    pub_sud internal information

    SUMM   summary

    DIMN    dimension

    CTX      app context

    OUTL    stored outlines

    TULS     ruleset objects

    RMGR   resource manager

    XDBS    xdb schema

    PPLN     pending scheduler plan

    PCLS     pending scheduler class

    SUBS     subscription information

    LOCS    location information

    RMOB   remote objects info

    RSMD   RepAPI snapshot metadata

    JVSD     java shared data

    STFG    file group

    TRANS  transformation

    RELC     replication – log based child

    STRM    stream:capture process in log-based replication

    REVC    rule evaluation context

    STAP     stream:apply process in log-based replication

    RELS     source inlog-based replication

    RELD    destination in log-based replication

    IFSD     IFS schema

    XDBC    XDB configuration management

    USAG    user agent mapping

    VOMDTABL  multi-versioned object for table

    JSQI      scheduler-event queue info object

    CDCS    change set

    VOMDINDX multi-versioned object for index

    STBO    sql tuing base object

    HTSP     hintset    object

    JSGA     scheduler global attributes

    JSET     scheduler start time namespace

    TABL_T temporary table

    CLST_T temporary cluster

    INDX_Ttemporary index

    SCPD    sratch pad

    JSLV      scheduler job slave

    MODL   mining models


    状态标志位的取值:

    EXS       existent

    NEX      no-existent

    LOC

    CRT       being created

    ALT       being altered

    DRP       being dropped

    PRG       being purged

    UPD      being uodated

    RIV       marked for rolling invalidation

    NRC      don’t recover when an exclusive pin fails

    UDP      dep being updated

    BOW     bad owner of database link

    MEM     has frame memory associated with heap 0

    REA       protected with read-only access at least once

    NOA      protected with no access at least once


    通过对library cache object/handle的分析,可以找到相关的sql以及cursor的状态。


    Find Past Image in RAC Global Cache

    Instance 1:

    Start dump data blocks tsn: 0 file#:1 minblk 95753 maxblk 95753
    Block dump from cache:
    Dump of buffer cache at level 4 for tsn=0, rdba=4290057
    BH (0x8df55108) file#: 1 rdba: 0x00417609 (1/95753) class: 1 ba: 0x8dc86000
      set: 6 pool: 3 bsz: 8192 bsi: 0 sflg: 2 pwc: 58,28
      dbwrid: 0 obj: 84318 objn: 84318 tsn: 0 afn: 1 hint: f
      hash: [0x8df54308,0xd6cb7438] lru: [0x96ecccd8,0xd6e9a080]
      ckptq: [NULL] fileq: [NULL] objq: [0xcedd4f18,0xcedd4f18] objaq: [0x96eccd10,0xcedd4f08]
      use: [0xd6e1ee70,0xd6e1ee70] wait: [NULL]
      st: READING md: EXCL tch: 0 le: 0x7bfa6000                  reading gc,associated with lock element 0x7bfa6000
      flags: only_sequential_access
      cr pin refcnt: 0 sh pin refcnt: 0
    BH (0x8df54258) file#: 1 rdba: 0x00417609 (1/95753) class: 1 ba: 0x8dc72000
      set: 6 pool: 3 bsz: 8192 bsi: 0 sflg: 2 pwc: 58,28
      dbwrid: 0 obj: 84318 objn: 84318 tsn: 0 afn: 1 hint: f
      hash: [0x96eccca0,0x8df551b8] lru: [0xd6e9a080,0x8df54a98]
      lru-flags: moved_to_tail
      ckptq: [NULL] fileq: [NULL] objq: [NULL] objaq: [NULL]
      use: [0xd6e22f30,0xd6e22f30] wait: [NULL]
      st: CR md: SHR tch: 0 le: (nil)
      cr: [scn: 0x0.ac6456],[xid: 0x0.0.0],[uba: 0x0.0.0],[cls: 0x0.ac6456],[sfl: 0x2],[lc: 0x0.ac6451]
      flags: only_sequential_access
      cr pin refcnt: 0 sh pin refcnt: 0
    BH (0x96eccbf0) file#: 1 rdba: 0x00417609 (1/95753) class: 1 ba: 0x960ec000
      set: 6 pool: 3 bsz: 8192 bsi: 0 sflg: 2 pwc: 58,28
      dbwrid: 0 obj: 84318 objn: 84318 tsn: 0 afn: 1 hint: f
      hash: [0x8df54a60,0x8df54308] lru: [0x8df547a8,0x8df551f0]
      obj-flags: object_ckpt_list
      ckptq: [0x8eecba50,0x8df54ca0] fileq: [0xd6eb8370,0x8df679c8] objq: [0xcedd4f28,0xcedd4f28] objaq: [0xcedd4f08,0x8df55228]
      st: PI md: NULL tch: 1 le: 0x7bfa6000                        -- Past Image
      cr: [scn: 0x0.ac6452],[xid: 0x0],[uba: 0x0],[cls: 0x0.ac6452],[sfl: 0x0]
      flags: buffer_dirty remote_transfered
      LRBA: [0x132.a1c.0] LSCN: [0x0.abb823] HSCN: [0x0.ac6451] HSUB: [2]
      cr pin refcnt: 0 sh pin refcnt: 0
    BH (0x8df549b0) file#: 1 rdba: 0x00417609 (1/95753) class: 1 ba: 0x8dc7c000
      set: 6 pool: 3 bsz: 8192 bsi: 0 sflg: 2 pwc: 58,28
      dbwrid: 0 obj: 84318 objn: 84318 tsn: 0 afn: 1 hint: f
      hash: [0x8df53ea0,0x96eccca0] lru: [0x8df54340,0x8df544b8]
      lru-flags: moved_to_tail
      ckptq: [NULL] fileq: [NULL] objq: [NULL] objaq: [NULL]
      st: CR md: NULL tch: 1 le: (nil)
      cr: [scn: 0x0.ac643a],[xid: 0x0.0.0],[uba: 0x0.0.0],[cls: 0x0.ac643a],[sfl: 0x0],[lc: 0x0.0]
      flags: remote_transfered
      cr pin refcnt: 0 sh pin refcnt: 0
    BH (0x8df53df0) file#: 1 rdba: 0x00417609 (1/95753) class: 1 ba: 0x8dc6c000
      set: 6 pool: 3 bsz: 8192 bsi: 0 sflg: 2 pwc: 58,28
      dbwrid: 0 obj: 84318 objn: 84318 tsn: 0 afn: 1 hint: f
      hash: [0x8df54480,0x8df54a60] lru: [0x8df544b8,0x8df541c8]
      lru-flags: moved_to_tail
      ckptq: [NULL] fileq: [NULL] objq: [NULL] objaq: [NULL]
      st: CR md: NULL tch: 1 le: (nil)
      cr: [scn: 0x0.ac642a],[xid: 0x0.0.0],[uba: 0x0.0.0],[cls: 0x0.ac642a],[sfl: 0x2],[lc: 0x0.ac6426]
      flags: only_sequential_access
      cr pin refcnt: 0 sh pin refcnt: 0
    BH (0x8df543d0) file#: 1 rdba: 0x00417609 (1/95753) class: 1 ba: 0x8dc74000
      set: 6 pool: 3 bsz: 8192 bsi: 0 sflg: 2 pwc: 58,28
      dbwrid: 0 obj: 84318 objn: 84318 tsn: 0 afn: 1 hint: f
      hash: [0x8df54190,0x8df53ea0] lru: [0x8df54a98,0x8df53ed8]
      lru-flags: moved_to_tail
      ckptq: [NULL] fileq: [NULL] objq: [NULL] objaq: [NULL]
      st: CR md: NULL tch: 1 le: (nil)
      cr: [scn: 0x0.ac6427],[xid: 0x0.0.0],[uba: 0x0.0.0],[cls: 0x0.ac6427],[sfl: 0x0],[lc: 0x0.0]
      flags: remote_transfered
      cr pin refcnt: 0 sh pin refcnt: 0
    BH (0x8df540e0) file#: 1 rdba: 0x00417609 (1/95753) class: 1 ba: 0x8dc70000
      set: 6 pool: 3 bsz: 8192 bsi: 0 sflg: 2 pwc: 58,28
      dbwrid: 0 obj: 84318 objn: 84318 tsn: 0 afn: 1 hint: f
      hash: [0x92ec39c0,0x8df54480] lru: [0x8df53ed8,0x8eecc870]
      lru-flags: moved_to_tail
      ckptq: [NULL] fileq: [NULL] objq: [NULL] objaq: [NULL]
      st: CR md: NULL tch: 1 le: (nil)
      cr: [scn: 0x0.ac641a],[xid: 0x0.0.0],[uba: 0x0.0.0],[cls: 0x0.ac641a],[sfl: 0x0],[lc: 0x0.0]
      flags: remote_transfered
      cr pin refcnt: 0 sh pin refcnt: 0
    Block dump from disk:
    buffer tsn: 0 rdba: 0x00417609 (1/95753)
    scn: 0x0000.00abb7cf seq: 0x01 flg: 0x06 tail: 0xb7cf0601
    frmt: 0x02 chkval: 0xeab4 type: 0x06=trans data
    Hex dump of block: st=0, typ_found=1
    Dump of memory from 0x00007F85F7BA9A00 to 0x00007F85F7BABA00
    7F85F7BA9A00 0000A206 00417609 00ABB7CF 06010000  [.....vA.........]
    7F85F7BA9A10 0000EAB4 00000001 0001495E 00ABB7CE  [........^I......]
    7F85F7BA9A20 00000000 00030002 00000000 00080012  [................]
    7F85F7BA9A30 00000AE2 01804A41 0009010A 00002001  [....AJ....... ..]
    7F85F7BA9A40 00ABB7CF 000B0011 00000822 01804BA9  [........"....K..]
    7F85F7BA9A50 001200BD 00008000 00ABB7CD 00010100  [................]
    7F85F7BA9A60 0014FFFF 1F830376 00001F83 03760001  [....v.........v.]
    7F85F7BA9A70 2C000000 0401002C 641E57C3 0301002C  [...,,....W.d,...]
    7F85F7BA9A80 2C1E57C3 C3040100 2C641D57 C3030100  [.W.,....W.d,....]
    7F85F7BA9A90 002C1D57 57C30401 002C641C 57C30301  [W.,....W.d,....W]
    7F85F7BA9AA0 01002C1C 1B57C304 01002C64 1B57C303  [.,....W.d,....W.]
    7F85F7BA9AB0 0401002C 641A57C3 0301002C 2C1A57C3  [,....W.d,....W.,]
    7F85F7BA9AC0 C3040100 2C641957 C3030100 002C1957  [....W.d,....W.,.]
    7F85F7BA9AD0 57C30401 002C6418 57C30301 01002C18  [...W.d,....W.,..]
    7F85F7BA9AE0 1757C304 01002C64 1757C303 0401002C  [..W.d,....W.,...]
    7F85F7BA9AF0 641657C3 0301002C 2C1657C3 C3040100  [.W.d,....W.,....]
    7F85F7BA9B00 00000000 00000000 00000000 00000000  [................]
            Repeat 44 times
    7F85F7BA9DD0 012C0000 5CC30401 002C3B0B 5CC30301  [..,....\.;,....\]
    7F85F7BA9DE0 01002C0B 0A5CC304 01002C64 0A5CC303  [.,....\.d,....\.]
    7F85F7BA9DF0 0401002C 64095CC3 0301002C 2C095CC3  [,....\.d,....\.,]
    7F85F7BA9E00 C3040100 2C64085C C3030100 002C085C  [....\.d,....\.,.]
    7F85F7BA9E10 5CC30401 002C6407 5CC30301 01002C07  [...\.d,....\.,..]
    7F85F7BA9E20 065CC304 01002C64 065CC303 0401002C  [..\.d,....\.,...]
    7F85F7BA9E30 64055CC3 0301002C 2C055CC3 C3040100  [.\.d,....\.,....]
    7F85F7BA9E40 2C64045C C3030100 002C045C 5CC30401  [\.d,....\.,....\]
    7F85F7BA9E50 002C6403 5CC30301 01002C03 025CC304  [.d,....\.,....\.]
    7F85F7BA9E60 01002C64 025CC303 0401002C 64015CC3  [d,....\.,....\.d]
    7F85F7BA9E70 0201002C 002C5CC3 5BC30401 002C6464  [,....\,....[dd,.]
    7F85F7BA9E80 5BC30301 01002C64 635BC304 01002C64  [...[d,....[cd,..]
    7F85F7BA9E90 635BC303 0401002C 64625BC3 0301002C  [..[c,....[bd,...]
    7F85F7BA9EA0 2C625BC3 C3040100 2C64615B C3030100  [.[b,....[ad,....]
    7F85F7BA9EB0 002C615B 5BC30401 002C6460 5BC30301  [[a,....[`d,....[]
    7F85F7BA9EC0 01002C60 5F5BC304 01002C64 5F5BC303  [`,....[_d,....[_]
    7F85F7BA9ED0 0401002C 645E5BC3 0301002C 2C5E5BC3  [,....[^d,....[^,]
    7F85F7BA9EE0 C3040100 2C645D5B C3030100 002C5D5B  [....[]d,....[],.]
    7F85F7BA9EF0 5BC30401 002C645C 5BC30301 01002C5C  [...[\d,....[\,..]
    7F85F7BA9F00 5B5BC304 01002C64 5B5BC303 0401002C  [..[[d,....[[,...]
    7F85F7BA9F10 645A5BC3 0301002C 2C5A5BC3 C3040100  [.[Zd,....[Z,....]
    7F85F7BA9F20 2C64595B C3030100 002C595B 5BC30401  [[Yd,....[Y,....[]
    7F85F7BA9F30 002C6458 5BC30301 01002C58 575BC304  [Xd,....[X,....[W]
    7F85F7BA9F40 01002C64 575BC303 0401002C 64565BC3  [d,....[W,....[Vd]
    7F85F7BA9F50 0301002C 2C565BC3 C3040100 2C64555B  [,....[V,....[Ud,]
    7F85F7BA9F60 C3030100 002C555B 5BC30401 002C6454  [....[U,....[Td,.]
    7F85F7BA9F70 5BC30301 01002C54 535BC304 01002C64  [...[T,....[Sd,..]
    7F85F7BA9F80 535BC303 0401002C 64525BC3 0301002C  [..[S,....[Rd,...]
    7F85F7BA9F90 2C525BC3 C3040100 2C64515B C3030100  [.[R,....[Qd,....]
    7F85F7BA9FA0 002C515B 5BC30401 002C6450 5BC30301  [[Q,....[Pd,....[]
    7F85F7BA9FB0 01002C50 4F5BC304 01002C64 4F5BC303  [P,....[Od,....[O]
    7F85F7BA9FC0 0401002C 644E5BC3 0301002C 2C4E5BC3  [,....[Nd,....[N,]
    7F85F7BA9FD0 C3040100 2C644D5B C3030100 002C4D5B  [....[Md,....[M,.]
    7F85F7BA9FE0 5BC30401 002C644C 5BC30301 01002C4C  [...[Ld,....[L,..]
    7F85F7BA9FF0 4B5BC304 01002C64 4B5BC303 0401002C  [..[Kd,....[K,...]
    7F85F7BAA000 644A5BC3 0301002C 2C4A5BC3 C3040100  [.[Jd,....[J,....]
    7F85F7BAA010 2C64495B C3030100 002C495B 5BC30401  [[Id,....[I,....[]
    7F85F7BAA020 002C6448 5BC30301 01002C48 475BC304  [Hd,....[H,....[G]
    7F85F7BAA030 01002C64 475BC303 0401002C 64465BC3  [d,....[G,....[Fd]
    7F85F7BAA040 0301002C 2C465BC3 C3040100 2C64455B  [,....[F,....[Ed,]
    7F85F7BAA050 C3030100 002C455B 5BC30401 002C6444  [....[E,....[Dd,.]
    7F85F7BAA060 5BC30301 01002C44 435BC304 01002C64  [...[D,....[Cd,..]
    7F85F7BAA070 435BC303 0401002C 64425BC3 0301002C  [..[C,....[Bd,...]
    7F85F7BAA080 2C425BC3 C3040100 2C64415B C3030100  [.[B,....[Ad,....]
    7F85F7BAA090 002C415B 5BC30401 002C6440 5BC30301  [[A,....[@d,....[]
    7F85F7BAA0A0 01002C40 3F5BC304 01002C64 3F5BC303  [@,....[?d,....[?]
    7F85F7BAA0B0 0401002C 643E5BC3 0301002C 2C3E5BC3  [,....[>d,....[>,]
    7F85F7BAA0C0 C3040100 2C643D5B C3030100 002C3D5B  [....[=d,....[=,.]
    7F85F7BAA0D0 5BC30401 002C643C 5BC30301 01002C3C  [...[d,....Z>,....Z]
    7F85F7BAA6A0 002C643D 5AC30301 01002C3D 3C5AC304  [=d,....Z=,....Z<]
    7F85F7BAA6B0 01002C64 3C5AC303 0401002C 643B5AC3  [d,....Z<,....Z;d]
    7F85F7BAAC70 59C30301 01002C3E 3D59C304 01002C64  [...Y>,....Y=d,..]
    7F85F7BAAC80 3D59C303 0401002C 643C59C3 0301002C  [..Y=,....Yd,....X>]
    7F85F7BAB250 0401002C 643D58C3 0301002C 2C3D58C3  [,....X=d,....X=,]
    7F85F7BAB260 C3040100 2C643C58 C3030100 002C3C58  [....Xd,....W>,....]
    7F85F7BAB830 2C643D57 C3030100 002C3D57 57C30401  [W=d,....W=,....W]
    7F85F7BAB840 002C643C 57C30301 01002C3C 3B57C304  [1, wm 32768, RMno 0, reminc 62, dom 0]
     Block header dump:  0x00417609
     Object id on Block? Y
     seg/obj: 0x1495e  csc: 0x00.abb7ce  itc: 2  flg: O  typ: 1 - DATA
         fsl: 0  fnx: 0x0 ver: 0x01
    
     Itl           Xid                  Uba         Flag  Lck        Scn/Fsc
    0x01   0x0012.008.00000ae2  0x01804a41.010a.09  --U-    1  fsc 0x0000.00abb7cf
    0x02   0x0011.00b.00000822  0x01804ba9.00bd.12  C---    0  scn 0x0000.00abb7cd
    bdba: 0x00417609
    data_block_dump,data header at 0x7f85f7ba9a5c
    ===============
    tsiz: 0x1fa0
    hsiz: 0x14
    pbl: 0x7f85f7ba9a5c
         76543210
    flag=--------
    ntab=1
    nrow=1
    frre=-1
    fsbo=0x14
    fseo=0x376
    avsp=0x1f83
    tosp=0x1f83
    0xe:pti[0]	nrow=1	offs=0
    0x12:pri[0]	offs=0x376
    block_row_dump:
    tab 0, row 0, @0x376
    tl: 8 fb: --H-FL-- lb: 0x1  cc: 1
    col  0: [ 4]  c3 5c 0b 3b
    end_of_block_dump
    GLOBAL CACHE ELEMENT DUMP (address: 0x7bfa6000):          --lock element
      id1: 0x17609 id2: 0x1 pkey: OBJ#84318 block: (1/95753)
      lock: NG rls: 0x0 acq: 0x3 latch: 7                     -- NULL GLOBAL
      flags: 0x20 fair: 0 recovery: 0 fpin: 'ktswh23: ktsfbkl'
      bscn: 0x0.ac6451 bctx: (nil) write: 0 scan: 0xd000005
      lcp: 0xd36ce7a0 lnk: [0xd36ce7f8,0xd36ce7f8] lch: [0x96eccd20,0x8df55238]
      seq: 34524 hist: 17 146:6 14 8 324 50 38 231 230 227 21 37:2 145:0
      LIST OF BUFFERS LINKED TO THIS GLOBAL CACHE ELEMENT:
        flg: 0x00080000 state: READING tsn: 0 tsh: 0 mode: EXCL
          pin: 'kduwh01: kdusru'
          addr: 0x8df55108 obj: 84318 cls: DATA bscn: 0x0.0
        flg: 0x08000001 state: PI tsn: 0 tsh: 1
          addr: 0x96eccbf0 obj: 84318 cls: DATA bscn: 0x0.ac6451
          piscn: 0x0.ac6452 clscn: 0x0.ac6452
     GCS SHADOW 0x7bfa6078,1 resp[0xcfe5c5e0,0x17609.1] pkey 84318.0
       grant 0 cvt 2 mdrole 0xc8 st 0x101 lst 0xc0 CONVERTQ rl G1
       master 1 owner 1 sid 0 remote[(nil),0] hist 0x88149530f062c288
       history 0x8.0x5.0xb.0x3.0xf.0x26.0x25.0xa.0x8.0x1.
       cflag 0x0 sender 0 flags 0x10 replay# 0 abast (nil).x0.1 dbmap (nil)
       disk: 0x0000.00000000 write request: 0x0000.00000000
       pi scn: 0x0000.00ac6452 sq[0xcfe5c620,0xcfe5c620]
       msgseq 0x0 updseq 0x0 reqids[22469,0,0] infop 0xcee3d880 lockseq x187
     GCS SHADOW END
     GCS RESOURCE 0xcfe5c5e0 hashq [0xdb595658,0xcfe62578] name[0x17609.1] pkey 84318.0
       grant 0xcecec160 cvt 0x7bfa6078 send 0xcecec160@1,3 write (nil),0@65536
       flag 0x10002 mdrole 0x42 mode 2 scan 0.232 role GLOBAL
       disk: 0x0000.00abb7cf write: 0x0000.00000000 cnt 0x0 hist 0xd7
       xid 0x0000.000.00000000 sid 0 pkwait 0s rmacks 0
       refpcnt 0 weak: 0x0000.00000000
       pkey 84318.0
       hv 119 [stat 0x0, 1->1, wm 32768, RMno 0, reminc 62, dom 0]
       kjga st 0x4, step 0.0.0, cinc 64, rmno 15, flags 0x0
       lb 0, hb 0, myb 32449, drmb 32449, apifrz 0
       GCS SHADOW 0xcecec160,3 resp[0xcfe5c5e0,0x17609.1] pkey 84318.0
         grant 2 cvt 0 mdrole 0xc2 st 0x100 lst 0x40 GRANTQ rl G1
         master 1 owner 2 sid 0 remote[0x61f98bf8,43] hist 0x887299f0510e4126
         history 0x26.0x2.0x39.0x8.0x5.0x3e.0x26.0x39.0x8.0x1.
         cflag 0x0 sender 0 flags 0x10 replay# 0 abast (nil).x0.1 dbmap (nil)
         disk: 0x0000.00000000 write request: 0x0000.00000000
         pi scn: 0x0000.00ac6450 sq[0xcfe5c610,0xcfe5c610]
         msgseq 0x292b updseq 0x0 reqids[19172,0,0] infop (nil) lockseq xc4
       GCS SHADOW END
       GCS SHADOW 0x7bfa6078,1 resp[0xcfe5c5e0,0x17609.1] pkey 84318.0
         grant 0 cvt 2 mdrole 0xc8 st 0x101 lst 0xc0 CONVERTQ rl G1
         master 1 owner 1 sid 0 remote[(nil),0] hist 0x88149530f062c288
         history 0x8.0x5.0xb.0x3.0xf.0x26.0x25.0xa.0x8.0x1.
         cflag 0x0 sender 0 flags 0x10 replay# 0 abast (nil).x0.1 dbmap (nil)
         disk: 0x0000.00000000 write request: 0x0000.00000000
         pi scn: 0x0000.00ac6452 sq[0xcfe5c620,0xcfe5c620]
         msgseq 0x0 updseq 0x0 reqids[22469,0,0] infop 0xcee3d880 lockseq x187
       GCS SHADOW END
     GCS RESOURCE END
    2011-06-22 20:51:21.737794 : kjbmbassert [0x17609.1]
    2011-06-22 20:51:21.738025 : kjbmsassert(0x17609.1)(2)
    End dump data blocks tsn: 0 file#: 1 minblk 95753 maxblk 95753

    Instance 2:

    Start dump data blocks tsn: 0 file#:1 minblk 95753 maxblk 95753
    Block dump from cache:
    Dump of buffer cache at level 4 for tsn=0, rdba=4290057
    BH (0xafed7940) file#: 1 rdba: 0x00417609 (1/95753) class: 1 ba: 0xaf1d8000
      set: 5 pool: 3 bsz: 8192 bsi: 0 sflg: 2 pwc: 15,19
      dbwrid: 0 obj: 84318 objn: 84318 tsn: 0 afn: 1 hint: f
      hash: [0xafed7410,0xd9fb48e0] lru: [0xaff06738,0xd52c01d8]
      obj-flags: object_ckpt_list
      ckptq: [0xd52c3d30,0xafed3d08] fileq: [0xd52c3d50,0xaff06660] objq: [0xaff06760,0xcb9c1060] objaq: [0xaff06770,0xcb9c1040]
      st: XCURRENT md: NULL tch: 1 le: 0x61f98b80
      flags: buffer_dirty remote_transfered
      LRBA: [0x55.f6e1.0] LSCN: [0x0.97bdb9] HSCN: [0x0.97bdc9] HSUB: [1]
      cr pin refcnt: 0 sh pin refcnt: 0
    BH (0xafed7360) file#: 1 rdba: 0x00417609 (1/95753) class: 1 ba: 0xaf1d0000
      set: 5 pool: 3 bsz: 8192 bsi: 0 sflg: 2 pwc: 15,19
      dbwrid: 0 obj: 84318 objn: 84318 tsn: 0 afn: 1 hint: f
      hash: [0xafed7298,0xafed79f0] lru: [0xd52c01d8,0xafed72d0]
      lru-flags: moved_to_tail
      ckptq: [NULL] fileq: [NULL] objq: [NULL] objaq: [NULL]
      st: CR md: NULL tch: 1 le: (nil)
      cr: [scn: 0x0.97bdc7],[xid: 0x0.0.0],[uba: 0x0.0.0],[cls: 0x0.97bdc7],[sfl: 0x0],[lc: 0x0.97bdc7]
      flags: remote_transfered
      cr pin refcnt: 0 sh pin refcnt: 0
    BH (0xafed71e8) file#: 1 rdba: 0x00417609 (1/95753) class: 1 ba: 0xaf1ce000
      set: 5 pool: 3 bsz: 8192 bsi: 0 sflg: 2 pwc: 15,19
      dbwrid: 0 obj: 84318 objn: 84318 tsn: 0 afn: 1 hint: f
      hash: [0xafed9460,0xafed7410] lru: [0xafed7448,0xafed9498]
      lru-flags: moved_to_tail
      ckptq: [NULL] fileq: [NULL] objq: [NULL] objaq: [NULL]
      st: CR md: NULL tch: 1 le: (nil)
      cr: [scn: 0x0.97bdc5],[xid: 0x0.0.0],[uba: 0x0.0.0],[cls: 0x0.97bdc5],[sfl: 0x0],[lc: 0x0.97bdc5]
      flags: remote_transfered
      cr pin refcnt: 0 sh pin refcnt: 0
    BH (0xafed93b0) file#: 1 rdba: 0x00417609 (1/95753) class: 1 ba: 0xaf1fc000
      set: 5 pool: 3 bsz: 8192 bsi: 0 sflg: 2 pwc: 15,19
      dbwrid: 0 obj: 84318 objn: 84318 tsn: 0 afn: 1 hint: f
      hash: [0xb0f18b48,0xafed7298] lru: [0xafed72d0,0xb0f18b80]
      lru-flags: moved_to_tail
      ckptq: [NULL] fileq: [NULL] objq: [NULL] objaq: [NULL]
      st: CR md: NULL tch: 1 le: (nil)
      cr: [scn: 0x0.97bdc3],[xid: 0x0.0.0],[uba: 0x0.0.0],[cls: 0x0.97bdc3],[sfl: 0x0],[lc: 0x0.97bdc3]
      flags: remote_transfered
      cr pin refcnt: 0 sh pin refcnt: 0
    BH (0xb0f18a98) file#: 1 rdba: 0x00417609 (1/95753) class: 1 ba: 0xb0762000
      set: 5 pool: 3 bsz: 8192 bsi: 0 sflg: 2 pwc: 15,19
      dbwrid: 0 obj: 84318 objn: 84318 tsn: 0 afn: 1 hint: f
      hash: [0xafed8148,0xafed9460] lru: [0xafed9498,0xafed8180]
      lru-flags: moved_to_tail
      ckptq: [NULL] fileq: [NULL] objq: [NULL] objaq: [NULL]
      st: CR md: NULL tch: 1 le: (nil)
      cr: [scn: 0x0.97bdc1],[xid: 0x0.0.0],[uba: 0x0.0.0],[cls: 0x0.97bdc1],[sfl: 0x0],[lc: 0x0.97bdc1]
      flags: remote_transfered
      cr pin refcnt: 0 sh pin refcnt: 0
    BH (0xafed8098) file#: 1 rdba: 0x00417609 (1/95753) class: 1 ba: 0xaf1e2000
      set: 5 pool: 3 bsz: 8192 bsi: 0 sflg: 2 pwc: 15,19
      dbwrid: 0 obj: 84318 objn: 84318 tsn: 0 afn: 1 hint: f
      hash: [0xaff06700,0xb0f18b48] lru: [0xb0f18b80,0xafef6d88]
      lru-flags: moved_to_tail
      ckptq: [NULL] fileq: [NULL] objq: [NULL] objaq: [NULL]
      st: CR md: NULL tch: 1 le: (nil)
      cr: [scn: 0x0.97bdbf],[xid: 0x0.0.0],[uba: 0x0.0.0],[cls: 0x0.97bdbf],[sfl: 0x0],[lc: 0x0.97bdbe]
      flags: remote_transfered
      cr pin refcnt: 0 sh pin refcnt: 0
    BH (0xaff06650) file#: 1 rdba: 0x00417609 (1/95753) class: 1 ba: 0xaf5d4000
      set: 5 pool: 3 bsz: 8192 bsi: 0 sflg: 2 pwc: 15,19
      dbwrid: 0 obj: 84318 objn: 84318 tsn: 0 afn: 1 hint: f
      hash: [0xd9fb48e0,0xafed8148] lru: [0xafed3b00,0xafed7a28]
      obj-flags: object_ckpt_list
      ckptq: [0xafed8f48,0xafed96a0] fileq: [0xafed7950,0xd52c3d50] objq: [0xcb9c1060,0xafed7a50] objaq: [0xb5ecd178,0xafed7a60]
      st: PI md: NULL tch: 1 le: 0x61f98b80               --Past Image
      cr: [scn: 0x0.97bdb4],[xid: 0x0],[uba: 0x0],[cls: 0x0.97bdb4],[sfl: 0x0]
      flags: buffer_dirty remote_transfered
      LRBA: [0x55.d365.0] LSCN: [0x0.978da0] HSCN: [0x0.97bdaf] HSUB: [1]
      cr pin refcnt: 0 sh pin refcnt: 0
    Block dump from disk:
    buffer tsn: 0 rdba: 0x00417609 (1/95753)
    scn: 0x0000.00978d91 seq: 0x01 flg: 0x06 tail: 0x8d910601
    frmt: 0x02 chkval: 0x81cc type: 0x06=trans data
    Hex dump of block: st=0, typ_found=1
    Dump of memory from 0x00002AB4A7A4EA00 to 0x00002AB4A7A50A00
    2AB4A7A4EA00 0000A206 00417609 00978D91 06010000  [.....vA.........]
    2AB4A7A4EA10 000081CC 00000001 0001495E 00978D8F  [........^I......]
    2AB4A7A4EA20 00000000 00030002 00000000 000C0014  [................]
    2AB4A7A4EA30 00000391 01801B5D 001300D0 00002001  [....]........ ..]
    2AB4A7A4EA40 00978D91 00210005 000010CF 00C0829C  [......!.........]
    2AB4A7A4EA50 00270376 00008000 00978D8D 00010100  [v.'.............]
    2AB4A7A4EA60 0014FFFF 1F8317E5 00001F83 17E50001  [................]
    2AB4A7A4EA70 2C000000 C3040100 2C642D21 C3030100  [...,....!-d,....]
    2AB4A7A4EA80 002C2D21 21C30401 002C642C 21C30301  [!-,....!,d,....!]
    2AB4A7A4EA90 01002C2C 2B21C304 01002C64 2B21C303  [,,....!+d,....!+]
    2AB4A7A4EAA0 0401002C 642A21C3 0301002C 2C2A21C3  [,....!*d,....!*,]
    2AB4A7A4EAB0 C3040100 2C642921 C3030100 002C2921  [....!)d,....!),.]
    2AB4A7A4EAC0 21C30401 002C6428 21C30301 01002C28  [...!(d,....!(,..]
    2AB4A7A4EAD0 2721C304 01002C64 2721C303 0401002C  [..!'d,....!',...]
    2AB4A7A4EAE0 642621C3 0301002C 2C2621C3 C3040100  [.!&d,....!&,....]
    2AB4A7A4EAF0 2C642521 C3030100 002C2521 21C30401  [!%d,....!%,....!]
    2AB4A7A4EB00 00000000 00000000 00000000 00000000  [................]
            Repeat 371 times
    2AB4A7A50240 01012C00 4D22C304 01002C5F 4D22C303  [.,...."M_,...."M]
    2AB4A7A50250 0401002C 644C22C3 0301002C 2C4C22C3  [,...."Ld,...."L,]
    2AB4A7A50260 C3040100 2C644B22 C3030100 002C4B22  [...."Kd,...."K,.]
    2AB4A7A50270 22C30401 002C644A 22C30301 01002C4A  [..."Jd,...."J,..]
    2AB4A7A50280 4922C304 01002C64 4922C303 0401002C  [.."Id,...."I,...]
    2AB4A7A50290 644822C3 0301002C 2C4822C3 C3040100  [."Hd,...."H,....]
    2AB4A7A502A0 2C644722 C3030100 002C4722 22C30401  ["Gd,...."G,...."]
    2AB4A7A502B0 002C6446 22C30301 01002C46 4522C304  [Fd,...."F,...."E]
    2AB4A7A502C0 01002C64 4522C303 0401002C 644422C3  [d,...."E,...."Dd]
    2AB4A7A502D0 0301002C 2C4422C3 C3040100 2C644322  [,...."D,...."Cd,]
    2AB4A7A502E0 C3030100 002C4322 22C30401 002C6442  [...."C,...."Bd,.]
    2AB4A7A502F0 22C30301 01002C42 4122C304 01002C64  [..."B,...."Ad,..]
    2AB4A7A50300 4122C303 0401002C 644022C3 0301002C  [.."A,...."@d,...]
    2AB4A7A50310 2C4022C3 C3040100 2C643F22 C3030100  [."@,...."?d,....]
    2AB4A7A50320 002C3F22 22C30401 002C643E 22C30301  ["?,....">d,...."]
    2AB4A7A50330 01002C3E 3D22C304 01002C64 3D22C303  [>,...."=d,...."=]
    2AB4A7A50340 0401002C 643C22C3 0301002C 2C3C22C3  [,...."d,....!>,...]
    2AB4A7A50910 643D21C3 0301002C 2C3D21C3 C3040100  [.!=d,....!=,....]
    2AB4A7A50920 2C643C21 C3030100 002C3C21 21C30401  [!1, wm 32768, RMno 0, reminc 62, dom 0]
    Block header dump:  0x00417609
     Object id on Block? Y
     seg/obj: 0x1495e  csc: 0x00.978d8f  itc: 2  flg: O  typ: 1 - DATA
         fsl: 0  fnx: 0x0 ver: 0x01
    
     Itl           Xid                  Uba         Flag  Lck        Scn/Fsc
    0x01   0x0014.00c.00000391  0x01801b5d.00d0.13  --U-    1  fsc 0x0000.00978d91
    0x02   0x0005.021.000010cf  0x00c0829c.0376.27  C---    0  scn 0x0000.00978d8d
    bdba: 0x00417609
    data_block_dump,data header at 0x2ab4a7a4ea5c
    ===============
    tsiz: 0x1fa0
    hsiz: 0x14
    pbl: 0x2ab4a7a4ea5c
         76543210
    flag=--------
    ntab=1
    nrow=1
    frre=-1
    fsbo=0x14
    fseo=0x17e5
    avsp=0x1f83
    tosp=0x1f83
    0xe:pti[0]	nrow=1	offs=0
    0x12:pri[0]	offs=0x17e5
    block_row_dump:
    tab 0, row 0, @0x17e5
    tl: 8 fb: --H-FL-- lb: 0x1  cc: 1
    col  0: [ 4]  c3 22 4d 5f
    end_of_block_dump
    GLOBAL CACHE ELEMENT DUMP (address: 0x61f98b80):                  --lock element
      id1: 0x17609 id2: 0x1 pkey: OBJ#84318 block: (1/95753)
      lock: XG rls: 0x0 acq: 0x0 latch: 7                           exclusive global
      flags: 0x20 fair: 0 recovery: 0 fpin: 'kduwh01: kdusru'
      bscn: 0x0.97bafa bctx: (nil) write: 0 scan: 0x0
      lcp: (nil) lnk: [NULL] lch: [0xaff06780,0xafed94e0]
      seq: 40651 hist: 58 58 58 58 58 58 58 58 58 58 58 58 58 58 58 58
        58 58 58 58
      LIST OF BUFFERS LINKED TO THIS GLOBAL CACHE ELEMENT:
        flg: 0x08000001 state: XCURRENT tsn: 0 tsh: 1 mode: SHR
          addr: 0xafed93b0 obj: 84318 cls: DATA
        flg: 0x08000001 state: PI tsn: 0 tsh: 1
          addr: 0xaff06650 obj: 84318 cls: DATA
          piscn: 0x0.97bdb4 clscn: 0x0.97bdb4
     GCS CLIENT 0x61f98bf8,42 resp[(nil),0x17609.1] pkey 84318.0       only client here,
       grant 2 cvt 0 mdrole 0xc2 st 0x100 lst 0x20 GRANTQ rl G1
       master 1 owner 2 sid 0 remote[0xcecec160,2] hist 0x8f0a41e071e1483c
       history 0x3c.0x10.0x5.0xf.0x7.0x3c.0x10.0x5.0xf.0x1.
       cflag 0x0 sender 1 flags 0x0 replay# 0 abast (nil).x0.1 dbmap (nil)
       disk: 0x0000.00978d9a write request: 0x0000.00000000
       pi scn: 0x0000.0097bdb4 sq[(nil),(nil)]
       msgseq 0x291c updseq 0x0 reqids[7233,0,0] infop (nil) lockseq xbd
       pkey 84318.0
       hv 119 [stat 0x0, 1->1, wm 32768, RMno 0, reminc 62, dom 0]
       kjga st 0x4, step 0.0.0, cinc 64, rmno 15, flags 0x0
       lb 0, hb 0, myb 61121, drmb 32449, apifrz 0
     GCS CLIENT END
    2011-06-22 20:34:29.243634 : kjbmbassert [0x17609.1]
    2011-06-22 20:34:29.243804 : kjbmsassert(0x17609.1)(1)
    End dump data blocks tsn: 0 file#: 1 minblk 95753 maxblk 95753
    0x7bfa6000

    The cache fusion technology evolves various background processes such as the GCS processes (identified by LMSn) and GES daemon (identified by LMD).

    The global cache service (GCS) and global enqueue service (GES) handle the management of the cluster piece of the database software. A global cache element is an Oracle-specific data structure representing a cache fusion resource. There is a 1:1 corresponding relationship between a global cache element and a cache fusion resource in the GCS.

    Oracle RAC uses a messaging mechanism to maintain resource statuses. Both GCS and GES use messages containing information to ensure that the current block image can be located. These messages also identify block copies being retained by any specific instance for use by the recovery mechanisms. The recovery-specific information contains sequence numbers to identify the order of changes made to that block since it was read from disk. The global resource directory (GRD) is a repository of information about the current status of resources shared by the instances. The GRD contains two groups of resources: enqueue resources, managed by the GES, and buffer cache resources, managed by the GCS. GCS and GES maintain the contents of the GRD.

    The LMSn are the processes that handle remote GCS messages. Oracle RAC software provides for up to 10 GCS processes. The number of LMSn processes varies depending on the number of CPU’s on the node. Oracle by default starts one LMS process for every two CPU’s. LMD is the resource-agent process that manages GES resource requests, such as deadlock detection of GES requests.

    GES and GCS

    The GES coordinates enqueues that are shared globally.

    The GCS is the controlling mechanism that implements cache fusion. It is responsible for block transfers between instances. In RAC, the cache fusion technology manages resources at the global level identified by a three-character lock structure.

    Three characters are required to distinguish resources. The first characterizes a traditional resource type: N (Null), S (Shared), or X (Exclusive).

    The second represents a role. There are two roles:

    • Local (L): The blocks associated with the resource can be manipulated without further reference to GCS or other instances. For example, when a resource is acquired for the first time, it is acquired with a local role.
    • Global (G): The blocks covered by the resource might not be usable without further information from the GCS or other nodes. For example, if the resource is acquired and it already has dirty buffers on a remote instance, then it takes on a global resource role.

    If the resource is in exclusive mode and has a local role, then the following rules apply:

    • Only one instance can have the resource in exclusive mode.
    • All unwritten changes must be in local cache.
    • At checkpoint, instances can write changed blocks to disk without confirmation from GCS.
    Mode Definition Description
    NL0 Null local 0 The same as N in Oracle OPS with no past image
    SL0 Shared local 0 The same as S in Oracle OPS with no past image
    XL0 Exclusive local 0 The same as X in Oracle OPS with no past image
    NG0 Null global 0 Global N lock and the Instance owns current block image.
    SG0 Shared global 0 Instance owns current block image and the resource can be shared with the other nodes, there is no past image. Can write current image.
    XG0 Exclusive global 0 Instance owns current block image for modification. Can write current image.
    NG1 Null global 1 Instance owns past block image. Can write PI image.
    SG1 Shared global 1 Instance owns past block image and the resource can be shared with the other nodes. Can write current and PI images.
    XG1 Exclusive global 1 Instance owns past block image for modification. Can write current and PI images.

    Writing Block and Recovery Considerations

    For recovery purposes, instances that have past images will keep these past images in their buffer cache until notified by the master instance of the resource to release them. A block written record (BWR) is placed in its redo log buffer when an instance writes a block covered by a global resource or when it is told it can free a PI buffer. This record indicates to the recovery process that redo information for the block is not needed at this time. Although the BWR makes recovery more efficient, the instance does not force a flush of the log buffer after creating it because it is not essential for accurate recovery.

    Each block PI has a system change number (SCN). Instances regularly synchronize their SCNs, and PI SCN is guaranteed to be later than the previous modification performed on this block and earlier than modifications performed by the next instance. When a write completes, the writer updates the GRD with write completion and the new SCN information. The GCS requests instances to flush all PIs having earlier SCNs than the one in the block written to disk.

    Checkpoints are more involved on RAC instances and generate more work. When a checkpoint occurs:

    • The GCS notifies all nodes with PI blocks that the checkpoint occurred.
    • The node with the most current PI will write dirty blocks to disk.
    • Resources are updated accordingly (global resources are changed to local, etc).
    • The Global Resource Directory is modified to reflect the resource changes.

    This is important to understand since the impact too many checkpoints have on a RAC system is greater than that of a standalone system. Checkpoints generate interconnect traffic and require each node with PI blocks to modify the GRD within the shared pool.

    沪ICP备14014813号-2

    沪公网安备 31010802001379号