深入了解Oracle自动内存管理asmm
View more documents from Maclean Liu
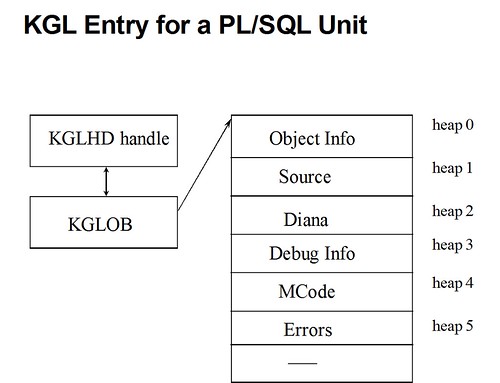
PL/SQL Program Units即PL/SQL程序单元,常被叫做”library units”或lib-units.
参考以下模块类型:
PL/SQL 虚拟机的内存使用主要体现在4个方面:
KGL – Kernel Generic Library Manager
该layer管理会话间需要共享的资源,如PL/SQL MCODE,Diana,Source,SQL cursor,SQL Plan)
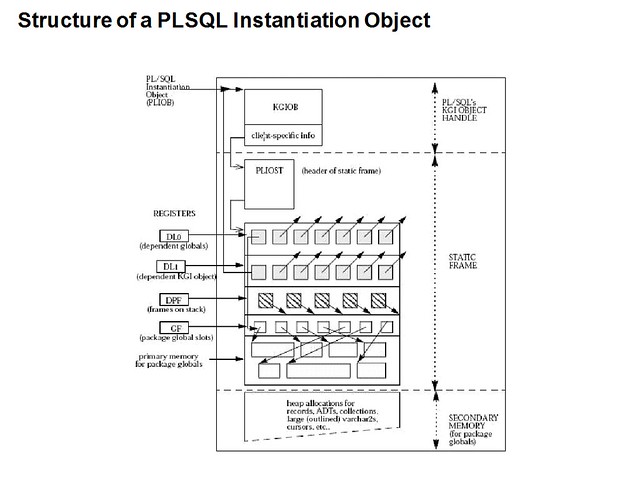
KGI – Kernel Generic Instantiation Layer.
该layer管理特定会话非共享的资源,如实例化的包含了包全局变量状态信息的PL/SQL程序单元
KOH/KGH 该layer用以管理heap service堆服务
PLSQL MCODE Heap的属性
MCODE Heap: Subcomponents
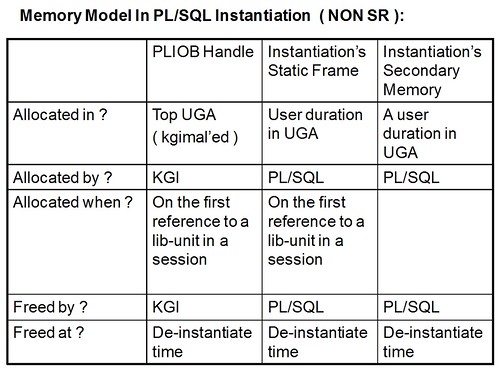
PL/SQL Instantiations
每一个Oracle的初学者在入门阶段都会接触到SGA/PGA的知识,如果是从10g开始学习那么会多或少会对ASMM有所了解,从使用的角度来说ASMM的出现极大地简化了Oracle内存初始化参数的设置,在ASMM的使用上高级DBA和初学者不会有太大的差别;很多人因此而认为ASMM极大程度地减少了数据库对于专业DBA的依赖:如果我们有一个足够智能的DB,那么为什么还要花费金钱雇佣DBA呢?这似乎是时下一种十分流行的想法。当然这种想法我个人是不能苟同的,ASMM一定程度上带来了便利,更大程度上它是一个黑盒,黑盒里面藏了很多秘密,这些秘密带来比手动管理更多的不确定性;在10g release 1和10.2的早期版本中ASMM扮演的角色有点像一个闯祸精,另一个让用户对ASMM很不待见的原因是ASMM直接拖慢了startup的速度。一个个人观点是ASMM也好AMM也罢,都要求产品数据库DBA掌握更多SGA/PGA相关的知识才能成功”驾驭”这些”有智力”的家伙,有点夸张的说这个时候的DBA很像一个chemist(需要和一大堆以1个或2个下划线开头的奇怪参数打交道)。
为了不辱使命我们真的有必要了解一下ASMM的基本知识,显然这并不是一件容易的事情……
Oracle的SGA基本内存组件从9i开始并没有非常大的变化,他们包括:
在9i中尚未引入ASMM,唯一的选择是手动管理的SGA,有时候也叫做MSMM。在9i中除去buffer cache的大小可以手动修改外,其余组件都无法动态修改。因为缺乏一种动态管理的机制,所以在9i中如果有某个内存区域有急用,也无法从其他有空闲内存的组件中捐献一些来解燃眉之急。
手动管理SGA的缺点在于:
ASMM的优势在于:
ASMM主要可以囊括为三个部分:
1.由一个新参数sga_target驱动的管理模式
2.内存交换的模型,包括了:内存组件(memory component),内存代理(memory broker)和内存交换机制(memory mechanism)
3.内存建议(memory advisor)
ASMM下一部分参数是自动设置的(Automatically set),这些参数包括:shared_pool_size、db_cache_size、java_pool_size、large_pool _size和streams_pool_size;而另外一些是需要手动设置的静态参数,包括了:db_keep_cache_size、db_recycle_cache_size、db_nk_cache_size、log_buffer以及固定SGA内存结构等,如果以上没有手动设置这些参数的话,除去log_buffer和fixed sga其他内存组件一般默认大小为零。
通过ASMM用户仅需要设置一个sga_target参数,其他参数都将由ASMM自行内部控制。但如果用户依旧设置了如db_cache_size、java_pool_size等参数,那么这些参数被认为是相关内存组件的最小限制,同时每个内存组件的大小也存在一个最大上限(内部的)。在实例启动阶段,Oracle会将必要的内存颗粒(granule,当SGA<1GB时granule大小为4M,当SGA>1GB时granule大小为16M)分配给内存组件,多余没有分配出去的全都分配给buffer cache,之后随着系统的不断活跃更多的内存颗粒(granule)将被分配给急需内存的组件。我们可以动态地修改sga_target参数,前提是所在的系统平台支持动态地共享内存(dism,主流平台都支持)。使用ASMM的一个必要条件是初始化参数statistics_level必须设置为typical或ALL,如果设置为BASIC那么MMON后台进程(Memory Monitor is a background process that gathers memory statistics (snapshots) stores this information in the AWR (automatic workload repository). MMON is also responsible for issuing alerts for metrics that exceed their thresholds)将无法有效分析内存的使用的统计信息从而驱动ASMM的自动调优,实际上我们不能同时设置sga_target为非零值和statistics_level为BASIC:
SQL> show parameter sga

NAME                                 TYPE        VALUE
------------------------------------ ----------- ------------------------------
lock_sga                             boolean     FALSE
pre_page_sga                         boolean     FALSE
sga_max_size                         big integer 2000M
sga_target                           big integer 2000M

SQL> show parameter sga_target

NAME                                 TYPE        VALUE
------------------------------------ ----------- ------------------------------
sga_target                           big integer 2000M

SQL> alter system set statistics_level=BASIC;
alter system set statistics_level=BASIC
*
ERROR at line 1:
ORA-02097: parameter cannot be modified because specified value is invalid
ORA-00830: cannot set statistics_level to BASIC with auto-tune SGA enabled
如果使用了server parameter file即spfile的话,ASMM会在实例shutdown之前将当前实际的内存组件大小(Oracle认为这是最优的,但实际上可能不是)保存到spfile中,如果你使用strings命令打印过spfile的内容的可以发现一些以双下划线开头的参数,如:
G10R2.__db_cache_size=973078528
G10R2.__java_pool_size=16777216
G10R2.__large_pool_size=16777216
G10R2.__shared_pool_size=1006632960
G10R2.__streams_pool_size=67108864
这些在spfile保存的组件大小会在下次启动时被沿用,以达到将已经实践得出的”最佳值”记住的目的,这样下次就不用从头再”学习”了。
在ASMM的内存交换模型中存在三类组件
内存交换模型中内存大小调整的申请(memory resize request)存在三种不同的模式,它们分别是:
立即内存申请(Immediate Request):这种申请模式一般出现在ASMM管理的某个自动调优组件在无法分配到连续可用内存块(chunk)时,为了避免出现OUT-OF-MEMORY(ORA-04031)的错误,系统尝试从其他候选组件中转移一个内存颗粒(granule)过来。需要注意的是当前可能没有可用的全空granule,这时就会出现不完整的转移,在此情形下系统会开始从候选组件中清理内存颗粒以满足内存申请,并将一个granule不完整地转移给急需内存的组件。
延迟内存申请(Deferred Request):这种申请一般出现在系统认为存在一种更为合理的内存分配时,考虑在组件之间转移一个或多个granule。用以判定最佳内存分配的依据是MMON进程所提供的统计信息delta.
手动内存申请(Manual Request):这种申请仅发生在用户使用alter system命令手动调整内存组件的大小时。在这种模式下仅允许使用空的内存颗粒参与大小调整。如果当时没有足够的空granule,那么针对组件grow操作会返回ORA-4033错误,而针对组件shrink操作会返回ORA-4034错误。

当ASMM被启用后,内存代理(Memory Broker)定期执行上图所示的活动。以上操作都处于延迟内存申请模式下(Deferred)。其目的是通过自动化的作业来调优自动调优组件(auto-tunable component)的大小以适应不断改变的工作负载,将内存分配到最需要它们的地方。MMON辅助进程会在后台不断将统计信息和内存建议定期地捕获到循环使用的内存中,并计算不同时期缓存信息之间的差值;MMON还会基于Memory Broker的策略分析这些差值并估算出长期和短期内的趋势。最后MMON基于以上分析生成一些内存组件的大小调整决议并将相应的申请发送到一个系统申请队列中(resize request system queue)。MMAN后台进程(Memory Manager is a background process that manages the dynamic resizing of SGA memory areas as the workload increases or decreases)会定期扫描系统申请队列并执行内存转移。
在10gR1中Shared Pool的shrink收缩操作存在一些缺陷,造成缺陷的原因是在该版本中Buffer Cache还没有能力共享使用一个granule,这是因为Buffer Cache的granule的尾部由granule header和Metadata(可能是buffer header或者RAC中的Lock Elements)拼接组成,在其尾部不容许存在空洞。另一个原因是当时的shared pool允许不同生命周期duration(以后会介绍)的chunk存放在同一个granule中,这造成共享池无法完全释放granule。到10gR2中通过对Buffer Cache Granule结构的修改允许在granule header和buffer及Metadata(buffer header或LE)存在缝隙,同时shared pool中不同duration的chunk将不在共享同一个granule,通过以上改进buffer cache与shared pool间的内存交换变得可行。此外在10gr2中streams pool也开始支持内存交换(实际根据不同的streams pool duration存在限制)
当某个组件扮演捐献者(Donor,下面的trace中会看到)角色时,它可能将一个不完整granule转移给buffer cache,那么在该granule被使用前需要完成以下步骤:
接着我们来了解一下内存转移的基本原理,当将buffer cache中的granule转移给shared pool时,将按照以下步骤:
实际使用中ASMM受到众多隐藏参数的影响,其中比较主要的参数有:
| Level | Contents |
| 0x01 | Enables statistics tracing |
| 0x02 | Enables policy tracing |
| 0x04 | Enables transfer of granules tracing |
| 0x08 | Enables startup tracing |
| 0x10 | Enables tuning tracing |
| 0x20 | Enables cache tracing |
接下来我们通过设置_memory_management_tracing隐藏参数和DUMP_TRANSFER_OPS转储来实地了解一次完整的内存转移,和不完整的内存转移。以下演示的完整trace文件可以从这里下载mman_trace、transfer_ops_dump。
SQL> alter system set "_memory_management_tracing"=63;
System altered

Operation make shared pool grow and buffer cache shrink!!!..............
以下为一个完整granule转移的过程,包括了对default buffer pool的resize操作:
AUTO SGA: Request 0xdc9c2628 after pre-processing, ret=0

/* 这里的0xdc9c2628是前台进程的addr */

AUTO SGA: IMMEDIATE, FG request 0xdc9c2628

/* 这里可以看到前台进程的Immediate立即申请  */

AUTO SGA: Receiver of memory is shared pool, size=16, state=3, flg=0

/* 此次申请的收益人是shared pool,共享池,其大小为16个granule,处于grow状态 */

AUTO SGA: Donor of memory is DEFAULT buffer cache, size=106, state=4, flg=0

/* 此处的捐献者是Default buffer cache,高速缓存,其大小为106个granule,处于shrink状态 */

AUTO SGA: Memory requested=3896, remaining=3896

/* 这里immeidate request所要求的空间是3896 bytes */

AUTO SGA: Memory received=0, minreq=3896, gransz=16777216

/* 这里没有free的granule,所以received为0,gransz为granule的大小 */

AUTO SGA: Request 0xdc9c2628 status is INACTIVE

/* 因为没有空的内存颗粒,先将申请置于inactive状态 */

AUTO SGA: Init bef rsz for request 0xdc9c2628

/* 为相关申请初始化before-process大小调整  */

AUTO SGA: Set rq dc9c2628 status to PENDING

/* 将request置于pending状态 */

AUTO SGA: 0xca000000 rem=3896, rcvd=16777216, 105, 16777216, 17

/* 返回起始地址为0xca000000的16M大小granule */

AUTO SGA: Returning 4 from kmgs_process for request dc9c2628
AUTO SGA: Process req dc9c2628 ret 4, 1, a
AUTO SGA: Resize done for pool DEFAULT, 8192

/* 完成对default pool的resize */

AUTO SGA: Init aft rsz for request 0xdc9c2628
AUTO SGA: Request 0xdc9c2628 after processing
AUTO SGA: IMMEDIATE, FG request 0x7fff917964a0
AUTO SGA: Receiver of memory is shared pool, size=17, state=0, flg=0
AUTO SGA: Donor of memory is DEFAULT buffer cache, size=105, state=0, flg=0
AUTO SGA: Memory requested=3896, remaining=0
AUTO SGA: Memory received=16777216, minreq=3896, gransz=16777216
AUTO SGA: Request 0x7fff917964a0 status is COMPLETE

/* shared pool成功收到16M的granule */

AUTO SGA: activated granule 0xca000000 of shared pool
以下为一个partial granule不完全内存颗粒的转移过程trace:
AUTO SGA: Request 0xdc9c2628 after pre-processing, ret=0
AUTO SGA: IMMEDIATE, FG request 0xdc9c2628

AUTO SGA: Receiver of memory is shared pool, size=82, state=3, flg=1
AUTO SGA: Donor of memory is DEFAULT buffer cache, size=36, state=4, flg=1

/* 此处的受益者仍为shared pool,而捐献者是default buffer cache */

AUTO SGA: Memory requested=4120, remaining=4120
AUTO SGA: Memory received=0, minreq=4120, gransz=16777216
AUTO SGA: Request 0xdc9c2628 status is INACTIVE
AUTO SGA: Init bef rsz for request 0xdc9c2628
AUTO SGA: Set rq dc9c2628 status to PENDING
AUTO SGA: Moving granule 0x93000000 of DEFAULT buffer cache to activate list
AUTO SGA: Moving 1 granule 0x8c000000 from inuse to quiesce list of DEFAULT buffer cache for an immediate req

/* 以上将buffer cache中起始地址为0x8c000000的granule从使用中列表inuse list,
    移动到静默列表quiesce list中 */

AUTO SGA: Returning 0 from kmgs_process for request dc9c2628
AUTO SGA: Process req dc9c2628 ret 0, 1, 20a
AUTO SGA: activated granule 0x93000000 of DEFAULT buffer cache
AUTO SGA: NOT_FREE for imm req for gran 0x8c000000

/ * 等待dbwr写出0x8c000000 granule中所有的dirty buffer */

AUTO SGA: Returning 0 from kmgs_process for request dc9c2628
AUTO SGA: Process req dc9c2628 ret 0, 1, 20a
AUTO SGA: NOT_FREE for imm req for gran 0x8c000000
AUTO SGA: Returning 0 from kmgs_process for request dc9c2628
AUTO SGA: Process req dc9c2628 ret 0, 1, 20a
AUTO SGA: NOT_FREE for imm req for gran 0x8c000000
AUTO SGA: Returning 0 from kmgs_process for request dc9c2628
AUTO SGA: Process req dc9c2628 ret 0, 1, 20a
AUTO SGA: NOT_FREE for imm req for gran 0x8c000000
AUTO SGA: Returning 0 from kmgs_process for request dc9c2628
AUTO SGA: Process req dc9c2628 ret 0, 1, 20a
AUTO SGA: NOT_FREE for imm req for gran 0x8c000000
AUTO SGA: Returning 0 from kmgs_process for request dc9c2628
AUTO SGA: Process req dc9c2628 ret 0, 1, 20a
AUTO SGA: NOT_FREE for imm req for gran 0x8c000000
.........................................

AUTO SGA: Rcv shared pool consuming 8192 from 0x8c000000 in granule 0x8c000000; owner is DEFAULT buffer cache
AUTO SGA: Rcv shared pool consuming 90112 from 0x8c002000 in granule 0x8c000000; owner is DEFAULT buffer cache
AUTO SGA: Rcv shared pool consuming 24576 from 0x8c01a000 in granule 0x8c000000; owner is DEFAULT buffer cache
AUTO SGA: Rcv shared pool consuming 65536 from 0x8c022000 in granule 0x8c000000; owner is DEFAULT buffer cache
AUTO SGA: Rcv shared pool consuming 131072 from 0x8c034000 in granule 0x8c000000; owner is DEFAULT buffer cache
AUTO SGA: Rcv shared pool consuming 286720 from 0x8c056000 in granule 0x8c000000; owner is DEFAULT buffer cache
AUTO SGA: Rcv shared pool consuming 98304 from 0x8c09e000 in granule 0x8c000000; owner is DEFAULT buffer cache
AUTO SGA: Rcv shared pool consuming 106496 from 0x8c0b8000 in granule 0x8c000000; owner is DEFAULT buffer cache
.....................

/* 以上shared pool开始消费0x8c000000 granule中的chunk,
    但此granule的owner暂时仍为default buffer cache */

AUTO SGA: Imm xfer 0x8c000000 from quiesce list of DEFAULT buffer cache to partial inuse list of shared pool

/* 以上将0x8c000000 granule从default buffer cache的静默列表转移到shared pool的不完整inuse list */

AUTO SGA: Returning 4 from kmgs_process for request dc9c2628
AUTO SGA: Process req dc9c2628 ret 4, 1, 20a
AUTO SGA: Init aft rsz for request 0xdc9c2628
AUTO SGA: Request 0xdc9c2628 after processing
AUTO SGA: IMMEDIATE, FG request 0x7fffe9bcd0e0
AUTO SGA: Receiver of memory is shared pool, size=83, state=0, flg=1
AUTO SGA: Donor of memory is DEFAULT buffer cache, size=35, state=0, flg=1
AUTO SGA: Memory requested=4120, remaining=0
AUTO SGA: Memory received=14934016, minreq=4120, gransz=16777216
AUTO SGA: Request 0x7fffe9bcd0e0 status is COMPLETE

/* 以上一个partial transfer完成 */
对应于以上partial transfer我们可以通过DUMP_TRANSFER_OPS来了解该0x8c000000 partial granule的实际使用情况,如:
SQL> oradebug setmypid;
Statement processed.

SQL> oradebug dump DUMP_TRANSFER_OPS 1;
Statement processed.

SQL> oradebug tracefile_name;
/s01/admin/G10R2/udump/g10r2_ora_21482.trc

=======================trace content==============================

GRANULE SIZE is 16777216
COMPONENT NAME : shared pool
Number of granules in partially inuse list (listid 4) is 23
Granule addr is 0x8c000000 Granule owner is DEFAULT buffer cache

/* 该0x8c000000 granule在shared pool的partially inuse list,
    但这里它的owner仍为default buffer cache */

Granule 0x8c000000 dump from owner perspective
gptr = 0x8c000000, num buf hdrs = 1989, num buffers = 156, ghdr = 0x8cffe000

/ * 可以看到该granule的granule header地址位于0x8cffe000,
     其中共有156个buffer block,1989个buffer header */

/* 以下granule中具体的内容,实际既包含了buffer cache也有shared pool chunk */

BH:0x8cf76018 BA:(nil) st:11 flg:20000
BH:0x8cf76128 BA:(nil) st:11 flg:20000
BH:0x8cf76238 BA:(nil) st:11 flg:20000
BH:0x8cf76348 BA:(nil) st:11 flg:20000
BH:0x8cf76458 BA:(nil) st:11 flg:20000
BH:0x8cf76568 BA:(nil) st:11 flg:20000
BH:0x8cf76678 BA:(nil) st:11 flg:20000
BH:0x8cf76788 BA:(nil) st:11 flg:20000
BH:0x8cf76898 BA:(nil) st:11 flg:20000
BH:0x8cf769a8 BA:(nil) st:11 flg:20000
BH:0x8cf76ab8 BA:(nil) st:11 flg:20000
BH:0x8cf76bc8 BA:(nil) st:11 flg:20000
BH:0x8cf76cd8 BA:0x8c018000 st:1 flg:622202
...............

Address 0x8cf30000 to 0x8cf74000 not in cache
Address 0x8cf74000 to 0x8d000000 in cache
Granule 0x8c000000 dump from receivers perspective
Dumping layout

Address 0x8c000000 to 0x8c018000 in sga heap(1,3) (idx=1, dur=4)
Address 0x8c018000 to 0x8c01a000 not in this pool
Address 0x8c01a000 to 0x8c020000 in sga heap(1,3) (idx=1, dur=4)
Address 0x8c020000 to 0x8c022000 not in this pool
Address 0x8c022000 to 0x8c032000 in sga heap(1,3) (idx=1, dur=4)
Address 0x8c032000 to 0x8c034000 not in this pool
Address 0x8c034000 to 0x8c054000 in sga heap(1,3) (idx=1, dur=4)
Address 0x8c054000 to 0x8c056000 not in this pool
Address 0x8c056000 to 0x8c09c000 in sga heap(1,3) (idx=1, dur=4)
Address 0x8c09c000 to 0x8c09e000 not in this pool
Address 0x8c09e000 to 0x8c0b6000 in sga heap(1,3) (idx=1, dur=4)
Address 0x8c0b6000 to 0x8c0b8000 not in this pool
Address 0x8c0b8000 to 0x8c0d2000 in sga heap(1,3) (idx=1, dur=4)
以上可以看到该granule真的是一个shared granule共享内存颗粒,其中不仅包含了部分buffer block,还包含了1号shared subpool共享池子池的durtaion为4的chunk,duration=4即execution duration;这类duration的chunk一般有着较短的生命周期,当其extent被置于quiesce list静默列表时将很有可能变得足够free。execution duration是共享池中唯一能可靠转移的,因此唯有该类duration所在的extent(一般来说一个extent占用一个granule)可以用来收缩。
以下我们列出一些有助于诊断ASMM问题的动态性能视图,仅供参考:
V$SGAINFO
Displays summary information about the system global area (SGA).
V$SGA
Displays size information about the SGA, including the sizes of different SGA components, the granule size, and free memory.
V$SGASTAT
Displays detailed information about the SGA.
V$SGA_DYNAMIC_COMPONENTS
Displays information about the dynamic SGA components. This view summarizes information based on all completed SGA resize operations since instance startup.
V$SGA_DYNAMIC_FREE_MEMORY
Displays information about the amount of SGA memory available for future dynamic SGA resize operations.
V$SGA_RESIZE_OPS
Displays information about the last 400 completed SGA resize operations.
V$SGA_CURRENT_RESIZE_OPS
Displays information about SGA resize operations that are currently in progress. A resize operation is an enlargement or reduction of a dynamic SGA component.
V$SGA_TARGET_ADVICE
Displays information that helps you tune SGA_TARGET.
近期内会写一篇介绍shared pool duration的文章,作为对这篇的补充。
待修订!!
一套Linux x86-64上的11.2.0.2数据库在startup启动阶段遭遇了ORA-27103:internal error内部错误,其出错日志如下:
SQL> startup nomount;
ORA-27103: internal error
Linux-x86_64 Error: 2: No such file or directory
Additional information: 9404423
Additional information: 2

oerr 27103
Usage: oerr facility error

Facility is identified by the prefix string in the error message.
For example, if you get ORA-7300, "ora" is the facility and "7300"
is the error.  So you should type "oerr ora 7300".

If you get LCD-111, type "oerr lcd 111", and so on.

================= alert.log ====================
This instance was first to mount
2011-05-02 21:49:47.009000 +08:00
Use ADRCI or Support Workbench to package the incident.
See Note 411.1 at My Oracle Support for error and packaging details.
Errors in file /s01/orabase/diag/rdbms/prod/PROD1/trace/PROD1_asmb_14386.trc:
ORA-04031: unable to allocate 393240 bytes of shared memory
("large pool","unknown object","large pool","ASM map operations hashtable")
ASMB (ospid: 14386): terminating the instance due to error 4031

System state dump requested by (instance=1, osid=14386 (ASMB)), summary=[abnormal instance termination].

System State dumped to trace file /s01/orabase/diag/rdbms/prod/PROD1/trace/PROD1_diag_14346.trc

Dumping diagnostic data in directory=[cdmp_20110502214947], requested by
(instance=1, osid=14386 (ASMB)), summary=[abnormal instance termination].

Instance terminated by ASMB, pid = 14386

=============================system state dump============================

PROCESS 24: ASMB
  ----------------------------------------
  SO: 0x92c955c8, type: 2, owner: (nil), flag: INIT/-/-/0x00 if: 0x3 c: 0x3
   proc=0x92c955c8, name=process, file=ksu.h LINE:12451, pg=0
  (process) Oracle pid:24, ser:1, calls cur/top: 0x9288c778/0x9288c778
            flags : (0x6) SYSTEM
            flags2: (0x0),  flags3: (0x0)
            intr error: 0, call error: 0, sess error: 0, txn error 0
            intr queue: empty
    ksudlp FALSE at location: 0
  (post info) last post received: 2296 0 2
              last post received-location: ksl2.h LINE:2293 ID:kslpsr
              last process to post me: 92c8e248 1 6
              last post sent: 0 0 26
              last post sent-location: ksa2.h LINE:282 ID:ksasnd
              last process posted by me: 92c8e248 1 6
    (latch info) wait_event=0 bits=0
    Process Group: DEFAULT, pseudo proc: 0x92d24ae0
    O/S info: user: oracle, term: UNKNOWN, ospid: 14386
    OSD pid info: Unix process pid: 14386, image: oracle@rh2.oracle.com (ASMB)
    ----------------------------------------
    SO: 0x92e80a58, type: 4, owner: 0x92c955c8, flag: INIT/-/-/0x00 if: 0x3 c: 0x3
     proc=0x92c955c8, name=session, file=ksu.h LINE:12459, pg=0
    (session) sid: 13 ser: 1 trans: (nil), creator: 0x92c955c8
              flags: (0x51) USR/- flags_idl: (0x1) BSY/-/-/-/-/-
              flags2: (0x408) -/-
              DID: , short-term DID:
              txn branch: (nil)
              oct: 0, prv: 0, sql: (nil), psql: (nil), user: 0/SYS
    ksuxds FALSE at location: 0
    service name: SYS$BACKGROUND
    Current Wait Stack:
      Not in wait; last wait ended 1.501399 sec ago
    Wait State:
      fixed_waits=0 flags=0x21 boundary=(nil)/-1
    Session Wait History:
        elapsed time of 1.501469 sec since last wait
     0: waited for 'SGA: allocation forcing component growth'
        =0x0, =0x0, =0x0
        wait_id=14 seq_num=27 snap_id=7
        wait times: snap=0.000000 sec, exc=0.305374 sec, total=0.305390 sec
        wait times: max=infinite
        wait counts: calls=6 os=6
        occurred after 0.000000 sec of elapsed time
     1: waited for 'SGA: allocation forcing component growth'
        =0x0, =0x0, =0x0
        wait_id=20 seq_num=26 snap_id=1
        wait times: snap=0.000001 sec, exc=0.000001 sec, total=0.000001 sec
        wait times: max=infinite
        wait counts: calls=1 os=1
        occurred after 0.000000 sec of elapsed time
     2: waited for 'SGA: allocation forcing component growth'
        =0x0, =0x0, =0x0
        wait_id=14 seq_num=25 snap_id=6
在没有阅读告警日志前我的第一反应可能是上次shutdown时Oracle进程没有被清理干净,导致shared memory segments一直没有释放,从而造成了以上ORA-27103错误。
不过其实这个问题告警日志里有明确的信息,即RDBMS Instance数据库实例在mount阶段asmb进程(负责db instance与asm instance的交互)试图从large pool大池中分配390k的空间,但遭遇了ORA-04031错误,如果asmb后台进程无法正常工作将直接导致db实例无法找到asm存储上的必要Extent,因此导致出出现了”ORA-27103: internal error:Linux-x86_64 Error: 2: No such file or directory”。
换而言之ORA-04031错误才是罪魁祸首,我们来是看该实例初始化的内存参数:
[oracle@rh2 dbs]$ strings spfilePROD1.ora |egrep "sga|memory|pool"
PROD1.__large_pool_size=16777216
*.memory_target=943718400
*.shared_pool_size=314572800
*.streams_pool_size=0
因为是11g的实例所以采用了automatic memory management特性管理直接设置了memory_target参数为900M,并设置了1号实例的large pool最小为16M,900M的大小对于10g的实例而言仍是绰绰有余的,但是显然在11gr2中设置memory_target为900M是不足以驱动这样一个”庞然大物”的。我们需要配置更多的内存,亦或者可以通过设置更大的large pool来解决令人郁闷的ORA-04031错误:
[oracle@rh2 dbs]$ strings spfilePROD1.ora > initPROD1.ora
[oracle@rh2 dbs]$ rm spfilePROD1.ora
[oracle@rh2 dbs]$ vi initPROD1.ora

/* 修改memory_target为至少912M */

*.memory_target=1200M
/* 成功启动! */
SQL> startup ;
ORACLE instance started.

Total System Global Area 1252663296 bytes
Fixed Size                  2226072 bytes
Variable Size             687868008 bytes
Database Buffers          553648128 bytes
Redo Buffers                8921088 bytes
Database mounted.
Database opened.

Private Interface 'eth1:1' configured from GPnP for use as a private interconnect.
  [name='eth1:1', type=1, ip=169.254.236.169, mac=94-0c-6d-71-8c-c2, net=169.254.0.0/16, mask=255.255.0.0, use=haip:cluster_interconnect/62]
Public Interface 'eth0' configured from GPnP for use as a public interface.
  [name='eth0', type=1, ip=192.168.1.121, mac=6c-f0-49-03-5f-99, net=192.168.1.0/24, mask=255.255.255.0, use=public/1]
Public Interface 'eth0:1' configured from GPnP for use as a public interface.
  [name='eth0:1', type=1, ip=192.168.1.133, mac=6c-f0-49-03-5f-99, net=192.168.1.0/24, mask=255.255.255.0, use=public/1]
Public Interface 'eth0:2' configured from GPnP for use as a public interface.
  [name='eth0:2', type=1, ip=192.168.1.122, mac=6c-f0-49-03-5f-99, net=192.168.1.0/24, mask=255.255.255.0, use=public/1]
Picked latch-free SCN scheme 3
2011-05-02 22:28:04.408000 +08:00
WARNING: db_recovery_file_dest is same as db_create_file_dest
Autotune of undo retention is turned on.
LICENSE_MAX_USERS = 0
SYS auditing is disabled
Starting up:
Oracle Database 11g Enterprise Edition Release 11.2.0.2.0 - 64bit Production
With the Partitioning, Real Application Clusters, OLAP, Data Mining
and Real Application Testing options.
Using parameter settings in server-side pfile /s01/oracle/product/11.2.0/dbhome_1/dbs/initPROD1.ora
System parameters with non-default values:
  processes                = 150
  shared_pool_size         = 304M
  streams_pool_size        = 0
  memory_target            = 1200M
  control_files            = "+DATA/prod/controlfile/current.261.747100215"
  control_files            = "+DATA/prod/controlfile/current.260.747100215"
  db_block_size            = 8192
  db_flash_cache_file      = "/flashcard/prod1cache.dsk"
  db_flash_cache_size      = 20G
  compatible               = "11.2.0.0.0"
  log_archive_dest_1       = "location=+DATA"
  cluster_database         = TRUE
  db_create_file_dest      = "+DATA"
  db_recovery_file_dest    = "+DATA"
  db_recovery_file_dest_size= 40320M
  thread                   = 1
  undo_tablespace          = "UNDOTBS1"
  instance_number          = 1
  db_domain                = ""
  dispatchers              = "(PROTOCOL=TCP) (SERVICE=PRODXDB)"
  remote_listener          = "rh-cluster-scan:1521"
  remote_listener          = "*.remote_login_pas"
  audit_file_dest          = "/s01/orabase/admin/PROD/adump"
  audit_trail              = "DB"
  db_name                  = "PROD"
  open_cursors             = 300
  diagnostic_dest          = "/s01/orabase"
Cluster communication is configured to use the following interface(s) for this instance
  169.254.236.169
cluster interconnect IPC version:Oracle UDP/IP (generic)
IPC Vendor 1 proto 2
2011-05-02 22:28:07.675000 +08:00
ORA-00132: syntax error or unresolved network name '*.remote_login_pas'
PMON started with pid=2, OS id=19807
PSP0 started with pid=3, OS id=19809
2011-05-02 22:28:08.754000 +08:00
VKTM started with pid=4, OS id=19811 at elevated priority
GEN0 started with pid=5, OS id=19815
VKTM running at (1)millisec precision with DBRM quantum (100)ms
DIAG started with pid=6, OS id=19817
DBRM started with pid=7, OS id=19819
PING started with pid=8, OS id=19821
ACMS started with pid=9, OS id=19823
DIA0 started with pid=10, OS id=19825
LMON started with pid=11, OS id=19827
LMD0 started with pid=12, OS id=19829
LMS0 started with pid=13, OS id=19831 at elevated priority
RMS0 started with pid=14, OS id=19835
LMHB started with pid=15, OS id=19837
MMAN started with pid=16, OS id=19839
* Load Monitor used for high load check
* New Low - High Load Threshold Range = [1920 - 2560]
LGWR started with pid=18, OS id=19843
DBW0 started with pid=17, OS id=19841
CKPT started with pid=19, OS id=19845
SMON started with pid=20, OS id=19847
RECO started with pid=21, OS id=19849
RBAL started with pid=22, OS id=19851
ASMB started with pid=23, OS id=19853
MMON started with pid=24, OS id=19855
starting up 1 dispatcher(s) for network address '(ADDRESS=(PARTIAL=YES)(PROTOCOL=TCP))'...
MMNL started with pid=25, OS id=19857
starting up 1 shared server(s) ...
lmon registered with NM - instance number 1 (internal mem no 0)
2011-05-02 22:28:09.825000 +08:00
NOTE: initiating MARK startup
Starting background process MARK
MARK started with pid=28, OS id=19866
NOTE: MARK has subscribed
Reconfiguration started (old inc 0, new inc 2)
List of instances:
 1 (myinst: 1)
 Global Resource Directory frozen
* allocate domain 0, invalid = TRUE
 Communication channels reestablished
 Master broadcasted resource hash value bitmaps
 Non-local Process blocks cleaned out
 LMS 0: 0 GCS shadows cancelled, 0 closed, 0 Xw survived
 Set master node info
 Submitted all remote-enqueue requests
 Dwn-cvts replayed, VALBLKs dubious
 All grantable enqueues granted
 Post SMON to start 1st pass IR
 Submitted all GCS remote-cache requests
 Post SMON to start 1st pass IR
 Fix write in gcs resources
Reconfiguration complete
LCK0 started with pid=30, OS id=19872
Starting background process RSMN
RSMN started with pid=31, OS id=19874
ORACLE_BASE from environment = /s01/orabase
2011-05-02 22:28:12.112000 +08:00
ALTER DATABASE   MOUNT
This instance was first to mount
2011-05-02 22:28:13.202000 +08:00
NOTE: Loaded library: System
ALTER SYSTEM SET
local_listener='(DESCRIPTION=(ADDRESS_LIST=(ADDRESS=(PROTOCOL=TCP)(HOST=192.168.1.122)(PORT=1521))))'
SCOPE=MEMORY SID='PROD1';
SUCCESS: diskgroup DATA was mounted
NOTE: dependency between database PROD and diskgroup resource ora.DATA.dg is established


/* 也可以直接增大large_pool_size来解决上述问题 */

large_pool_size=30M
memory_target=912M
Question:
I need to confirm my Linux kernel settings and also get pointers/explanation on how i need to properly setup my kernel for proper operation of the Oracle Server.
My aim for the SR is not so much to get actual answers on how to set values. Rather, I need help to clear up the concepts behind the numbers.
From the output of the commands below it can be seen that the server has 12 GB of memory and after the kernel is configured (see below output of ipcs -lms command), I have SHMMAX set at 8589933568.
After consulting various documents I have come to understand the following, please verify:
– The largest SGA size is that defined by PAGESIZE*kernel.shmall (in this case 16GB, which is a mistake apparently as the system only has 12GB of RAM)
– It is OK for shmmax to be smaller than the requested SGA. If additional size is needed, then the space will be allocated in multiple pages, as long as the size does not exceed PAGESIZE*kernel.shmall
– If more than one Oracle instances reside on the same server, then Linux Kernel settings will have to cater for the largest instance SGA, since
– … different instances will hold completely different memory segments, which will have to seperately adhere to kernel limitations, therefore the kernel limitations do not care for multiple instances, as those are different memory areas
– Memory for SGA is allocated completely by setting SGA_TARGET. In a different case, it will be allocated as needed
$ free
total used free shared buffers cached
Mem: 12299352 8217844 4081508 0 190816 6799828
-/+ buffers/cache: 1227200 11072152
Swap: 16775764 90912 16684852
ipcs -lms
—— Shared Memory Limits ——–
max number of segments = 4096
max seg size (kbytes) = 8388607
max total shared memory (kbytes) = 16777216
min seg size (bytes) = 1
—— Semaphore Limits ——–
max number of arrays = 128
max semaphores per array = 250
max semaphores system wide = 32000
max ops per semop call = 32000
semaphore max value = 32767
also ‘getconf PAGESIZE’ returns 4096
Answer:
– The largest SGA size is that defined by PAGESIZE*kernel.shmall (in this case 16GB, which is a mistake apparently as the system only has 12GB of RAM)
Comment :
Yes this needs to comply with the formula :
kernel.shmall = physical RAM size / pagesize as per NOTE:339510.1 .
– It is OK for shmmax to be smaller than the requested SGA. If additional size is needed, then the space will be allocated in multiple pages, as long as the size does not exceed PAGESIZE*kernel.shmall
Comment :
Yes it is ok to have SHMMAX<SGASIZE NOTE:567506.1 .
The allocation will be done in multiple shared segments either contigues
or non contiguous as per NOTE:15566.1
– If more than one Oracle instances reside on the same server, then Linux Kernel settings will have to cater for the largest instance SGA, since
different instances will hold completely different memory segments, which will have to seperately adhere to kernel limitations, therefore the kernel limitations do not care for multiple instances, as those are different memory areas.
Comment :
Yes thats valid for the SHMMAX , but for the SHMALL it is a systemwide
kernel variable affected by the physical memory and the pagesize .
– Memory for SGA is allocated completely by setting SGA_TARGET. In a different case, it will be allocated as needed.
comment :
Memory for the SGA is allocated completely by the SGA_MAX_SIZE .
I need to confirm my Linux kernel settings and also get pointers/explanation on how i need to properly setup my kernel for proper operation of the Oracle Server.
My aim for the SR is not so much to get actual answers on how to set values. Rather, I need help to clear up the concepts behind the numbers.
From the output of the commands below it can be seen that the server has 12 GB of memory and after the kernel is configured (see below output of ipcs -lms command), I have SHMMAX set at 8589933568.
After consulting various documents I have come to understand the following, please verify:
– The largest SGA size is that defined by PAGESIZE*kernel.shmall (in this case 16GB, which is a mistake apparently as the system only has 12GB of RAM)
– It is OK for shmmax to be smaller than the requested SGA. If additional size is needed, then the space will be allocated in multiple pages, as long as the size does not exceed PAGESIZE*kernel.shmall
– If more than one Oracle instances reside on the same server, then Linux Kernel settings will have to cater for the largest instance SGA, since
– … different instances will hold completely different memory segments, which will have to seperately adhere to kernel limitations, therefore the kernel limitations do not care for multiple instances, as those are different memory areas
– Memory for SGA is allocated completely by setting SGA_TARGET. In a different case, it will be allocated as needed
$ free
total used free shared buffers cached
Mem: 12299352 8217844 4081508 0 190816 6799828
-/+ buffers/cache: 1227200 11072152
Swap: 16775764 90912 16684852
ipcs -lms
—— Shared Memory Limits ——–
max number of segments = 4096
max seg size (kbytes) = 8388607
max total shared memory (kbytes) = 16777216
min seg size (bytes) = 1
—— Semaphore Limits ——–
max number of arrays = 128
max semaphores per array = 250
max semaphores system wide = 32000
max ops per semop call = 32000
semaphore max value = 32767
also ‘getconf PAGESIZE’ returns 4096
Can you kindly define and explain of lock_sga parameter?each flatform(HP, IBM, SUN) recommended value of both parameter
and why it is recommended like that value.
LOCK_SGA locks the entire SGA into physical memory. It is usually advisable to lock the SGA into real (physical) memory, especially if the use of virtual memory would include storing some of the SGA using disk space. This parameter is ignored on platforms that do not support it.
Each platform has its own recommendations and support over the parameter value. Hence you would see differences in the recommendations.
+ lock_sga Only locks the entire SGA into physical memory.
+ It can be set to TRUE as long as you want to lock the entire SGA in the physical memeory and your OS supports it. As for as i know it works in all the platforms.
LOCK_SGA locks the entire SGA into physical memory. It is usually advisable to lock the SGA into real (physical) memory, especially if the use of virtual memory would include storing some of the SGA using disk space.
NOTE:: This parameter is ignored on platforms that do not support it.
+ Windows For sure doesn’t support this parameter.
+ AIX Supports it.
+ LOCK_SGA is not supported on Solaris.
+ On Hp-UX if you have mlock (OS privilege) then LOCK_SGA is not required
+ Linux also supports this parameter
You can also review
Note 577898.1 – ORA-27102 Received At Startup When LOCK_SGA Is Set Although Enough Memory Is Available.
lock_sga: Default value: false.
If set to true, the entire SGA will be locked into physical memory (preventing it from being paged out). This may cause problems on systems with insufficient physical memory.
The parameters (and recommendations) are Unix generic.
The lock_sga parameter (which default AND recommended value is false): If you have sufficient memory on the server, you may consider setting it to true. (Forcing the SGA to be locked in physical memory).
On the other hand, if lock_sga is set to true, and you do not have suffficient memory, the SGA will stay in memory, and force other processe, like server processes to swap, and hence cause performance degradation.
For both the hidden and normal configuration parameters, we do not recommend deviations from the default values, without having detailed information on your specific configruation.
If you look at all Oracle products, options, features and parameters, there are billions of combinations. We do not have a complete catalog over each recommended values for each combiantion.
