Oracle内部错误:ORA-00600[kfioTranslateIO03]一例

一套Linux x86-64上的11.2.0.2 RAC+ASM系统,其中一个节点出现了ORA-00600[kfioTranslateIO03]内部错误,其具体日志如下:

=============================alert.log===============================
adrci> show alert -tail -f 

2011-05-30 20:29:12.657000 +08:00
Starting background process RSMN
RSMN started with pid=31, OS id=22084
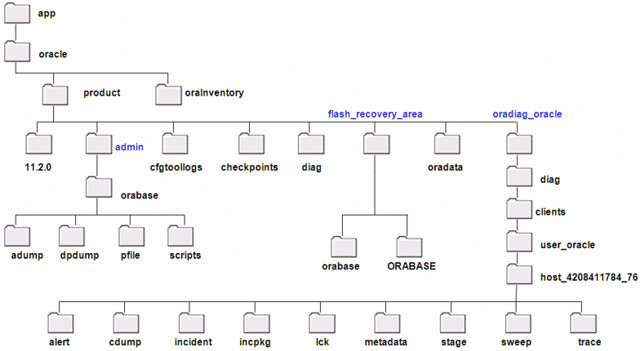
ORACLE_BASE not set in environment. It is recommended
that ORACLE_BASE be set in the environment
Reusing ORACLE_BASE from an earlier startup = /s01/orabase
ALTER DATABASE MOUNT /* db agent *//* {0:7:3} */
This instance was first to mount
2011-05-30 20:29:15.026000 +08:00
Sweep [inc][100831]: completed
Sweep [inc2][100831]: completed
NOTE: Loaded library: System
ORA-15025: could not open disk "/dev/raw/raw1"
ORA-27041: unable to open file
Linux-x86_64 Error: 13: Permission denied
Additional information: 9
ORA-15025: could not open disk "/dev/raw/raw2"
ORA-27041: unable to open file
Linux-x86_64 Error: 13: Permission denied
Additional information: 9
ORA-15025: could not open disk "/dev/raw/raw3"
ORA-27041: unable to open file
Linux-x86_64 Error: 13: Permission denied
Additional information: 9
ORA-15025: could not open disk "/dev/raw/raw5"
ORA-27041: unable to open file
Linux-x86_64 Error: 13: Permission denied
Additional information: 9
SUCCESS: diskgroup DATA was mounted
NOTE: dependency between database PROD and diskgroup resource ora.DATA.dg is established
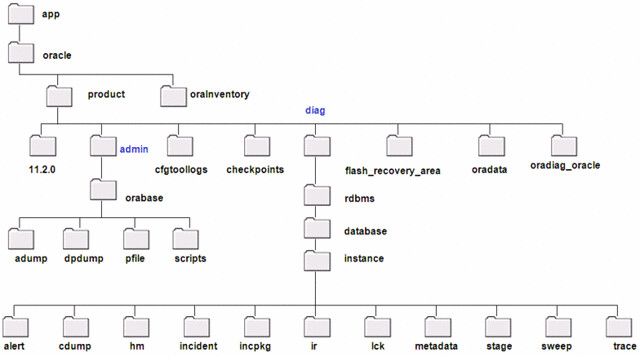
Errors in file /s01/orabase/diag/rdbms/prod/PROD1/trace/PROD1_ckpt_22056.trc  (incident=104831):

ORA-00600: internal error code, arguments: [kfioTranslateIO03], [], [], [], [], [], [], [], [], [], [], [] 

Incident details in: /s01/orabase/diag/rdbms/prod/PROD1/incident/incdir_104831/PROD1_ckpt_22056_i104831.trc
Use ADRCI or Support Workbench to package the incident.
See Note 411.1 at My Oracle Support for error and packaging details.

adrci> show problem 

ADR Home = /s01/orabase/diag/rdbms/prod/PROD1:
*************************************************************************
PROBLEM_ID           PROBLEM_KEY                                                 LAST_INCIDENT
-------------------- ----------------------------------------------------------- --------------------
2                    ORA 7445 [kghdmp_new()+1133]                                18387
3                    ORA 7445 [kghfnd()+2672]                                    20701
5                    ORA 7445 [kcldmp()+246]                                     28229
6                    ORA 7445 [kclxle()+311]                                     28230
1                    ORA 4031                                                    56918
4                    ORA 445                                                     90278
7                    ORA 600 [kfioTranslateIO03]                                 108831

adrci> show incident -mode detail -p "incident_id=108831"

ADR Home = /s01/orabase/diag/rdbms/prod/PROD1:
*************************************************************************

**********************************************************
INCIDENT INFO RECORD 1
**********************************************************
   INCIDENT_ID                   108831
   STATUS                        ready
   CREATE_TIME                   2011-05-30 20:31:55.484000 +08:00
   PROBLEM_ID                    7
   CLOSE_TIME
   FLOOD_CONTROLLED              none
   ERROR_FACILITY                ORA
   ERROR_NUMBER                  600
   ERROR_ARG1                    kfioTranslateIO03
   ERROR_ARG2
   ERROR_ARG3
   ERROR_ARG4
   ERROR_ARG5
   ERROR_ARG6
   ERROR_ARG7
   ERROR_ARG8
   ERROR_ARG9
   ERROR_ARG10
   ERROR_ARG11
   ERROR_ARG12
   SIGNALLING_COMPONENT          ASM
   SIGNALLING_SUBCOMPONENT
   SUSPECT_COMPONENT
   SUSPECT_SUBCOMPONENT
   ECID
   IMPACTS                       0
   PROBLEM_KEY                   ORA 600 [kfioTranslateIO03]
   FIRST_INCIDENT                96831
   FIRSTINC_TIME                 2011-05-30 20:24:40.372000 +08:00
   LAST_INCIDENT                 108831
   LASTINC_TIME                  2011-05-30 20:31:55.484000 +08:00
   IMPACT1                       0
   IMPACT2                       0
   IMPACT3                       0
   IMPACT4                       0
   KEY_NAME                      ProcId
   KEY_VALUE                     19.1
   KEY_NAME                      Client ProcId
   KEY_VALUE                     oracle@rh2.oracle.com.22504_139763918456544
   KEY_NAME                      SID
   KEY_VALUE                     397.1
   OWNER_ID                      1
   INCIDENT_FILE                 /s01/orabase/diag/rdbms/prod/PROD1/incident/incdir_108831/PROD1_ckpt_22504_i108831.trc
   OWNER_ID                      1
   INCIDENT_FILE                 /s01/orabase/diag/rdbms/prod/PROD1/trace/PROD1_ckpt_22504.trc
1 rows fetched

===================================trace===================================

adrci> view /s01/orabase/diag/rdbms/prod/PROD1/incident/incdir_108831/PROD1_ckpt_22504_i108831.trc

Dump continued from file: /s01/orabase/diag/rdbms/prod/PROD1/trace/PROD1_ckpt_22504.trc
ORA-00600: internal error code, arguments: [kfioTranslateIO03], [], [], [], [], [], [], [], [], [], [], []

========= Dump for incident 108831 (ORA 600 [kfioTranslateIO03]) ========
----- Beginning of Customized Incident Dump(s) -----
kfioRqSet=0x7f1d524151c0 parent=0x7fffb2642d30 gn=(64.0) cnt=0
  size=32768 vxn=0 byte offset=16384 buf offset=0
  tried[0]=0 tried[1]=0 tried[2]=0 tried[3]=0 tried[4]=0 tried[5]=0
  skipped[0]=0 skipped[1]=0 skipped[2]=0 skipped[3]=0 skipped[4]=0 skipped[5]=0
parent :
DDE: Ending a split invocation on error recording!
----- End of Customized Incident Dump(s) -----

*** 2011-05-30 20:31:55.548
dbkedDefDump(): Starting incident default dumps (flags=0x2, level=3, mask=0x0)
----- SQL Statement (None) -----
Current SQL information unavailable - no cursor.

----- Call Stack Trace -----
calling              call     entry                argument values in hex
location             type     point                (? means dubious value)
-------------------- -------- -------------------- ----------------------------
skdstdst()+36        call     kgdsdst()            000000000 ? 000000000 ?
                                                   7FFFB2634D58 ? 000000001 ?
                                                   000000001 ? 000000002 ?
ksedst1()+98         call     skdstdst()           000000000 ? 000000000 ?
                                                   7FFFB2634D58 ? 000000001 ?
                                                   000000000 ? 000000002 ?
ksedst()+34          call     ksedst1()            000000000 ? 000000001 ?
                                                   7FFFB2634D58 ? 000000001 ?
                                                   000000000 ? 000000002 ?
dbkedDefDump()+2741  call     ksedst()             000000000 ? 000000001 ?
                                                   7FFFB2634D58 ? 000000001 ?
                                                   000000000 ? 000000002 ?
ksedmp()+36          call     dbkedDefDump()       000000003 ? 000000002 ?
                                                   7FFFB2634D58 ? 000000001 ?
                                                   000000000 ? 000000002 ?
ksfdmp()+64          call     ksedmp()             000000003 ? 000000002 ?
                                                   7FFFB2634D58 ? 000000001 ?
                                                   000000000 ? 000000002 ?
dbgexPhaseII()+1764  call     ksfdmp()             000000003 ? 000000002 ?
                                                   7FFFB2634D58 ? 000000001 ?
                                                   000000000 ? 000000002 ?
dbgexExplicitEndInc  call     dbgexPhaseII()       7F1D5281F710 ? 7F1D52822500 ?
()+750                                             7FFFB2640890 ? 000000001 ?
                                                   000000000 ? 000000002 ?
dbgeEndDDEInvocatio  call     dbgexExplicitEndInc  7F1D5281F710 ? 7F1D52822500 ?
nImpl()+767                   ()                   7FFFB2640890 ? 000000001 ?
                                                   000000000 ? 000000002 ?
dbgeEndSpltInvokOnR  call     dbgeEndDDEInvocatio  7F1D5281F710 ? 7F1D52822500 ?
ec()+265                      nImpl()              7FFFB2640890 ? 000000001 ?
                                                   000000000 ? 000000002 ?
dbgePostErrorKGE()+  call     dbgeEndSpltInvokOnR  7F1D5281F710 ? 7F1D52822500 ?
248                           ec()                 7FFFB2640890 ? 000000001 ?
                                                   000000000 ? 000000002 ?
dbkePostKGE_kgsf()+  call     dbgePostErrorKGE()   000000000 ? 7F1D52830E40 ?
63                                                 000003AE9 ? 000000000 ?
                                                   100000000 ? 000000002 ?
kgeade()+351         call     dbkePostKGE_kgsf()   00B7C8EA0 ? 7F1D52830E40 ?
                                                   000003AE9 ? 000000000 ?
                                                   100000000 ? 000000002 ?
kgerelv()+135        call     kgeade()             00B7C8EA0 ? 00B7C9050 ?
                                                   7F1D52830E40 ? 000003AE9 ?
                                                   100000000 ? 000000002 ?
kserecl0()+157       call     kgerelv()            00B7C8EA0 ? 7F1D52830E40 ?
                                                   000003AE9 ? 00952980C ?
                                                   7FFFB2641C10 ? 000000000 ?
kfioErrorRecord()+7  call     kserecl0()           00B7C8EA0 ? 7F1D52830E40 ?
6                                                  000003AE9 ? 000000005 ?
                                                   7FFFB2641C60 ? 000000000 ?
kfiorq_dump()+129    call     kfioErrorRecord()    7FFFB2642D30 ? 7F1D52830E40 ?
                                                   000003AE9 ? 000000005 ?
                                                   7FFFB2641C60 ? 000000000 ?
kfioRqSetDump()+565  call     kfiorq_dump()        7FFFB2642D30 ? 7F1D52830E40 ?
                                                   000003AE9 ? 000000005 ?
                                                   7FFFB2641C60 ? 000000000 ?
kfioTranslateIO()+3  call     kfioRqSetDump()      7F1D524151C0 ? 7F1D52830E40 ?
079                                                000003AE9 ? 000000005 ?
kfioRqSetPrepare()+  call     kfioTranslateIO()    7F1D524151C0 ? 7F1D52415098 ?
1017                                               7FFFB26421D4 ? 7FFFB26421D0 ?
                                                   0D4F338B0 ? 000000000 ?
kfioSubmitIO()+2852  call     kfioRqSetPrepare()   7F1D524151C0 ? 7F1D52415098 ?
                                                   7FFFB26425D8 ? 7FFFB2642608 ?
                                                   0D4F338B0 ? 000000000 ?
kfioRequestPriv()+1  call     kfioSubmitIO()       7FFFB2642E10 ? 000000001 ?
94                                                 7FFFB26425D8 ? 7FFFB2642608 ?
                                                   0D4F338B0 ? 000000000 ?
kfioRequest()+701    call     kfioRequestPriv()    000000000 ? 000000001 ?
                                                   7FFFB2642E18 ? 000000001 ?
                                                   000000000 ? 000000000 ?
ksfd_kfioRequest()+  call     kfioRequest()        7FFFB2642E10 ? 000000001 ?
644                                                7FFFB2642E18 ? 000000001 ?
                                                   000000000 ? 7FFF00000000 ?
ksfd_osmio()+1050    call     ksfd_kfioRequest()   7FFFB2642E10 ? 000000001 ?
                                                   7FFFB2642E18 ? 000000001 ?
                                                   000000000 ? 000000000 ?
ksfd_io()+2717       call     ksfd_osmio()         000000001 ?
                                                   FFFFFFFFB2642D30 ?
                                                   FFFFFFFFB2642D30 ?
                                                   0D400A0B0 ? 000008000 ?
                                                   7FFFB2643170 ?
ksfdread()+576       call     ksfd_io()            0D400A0B0 ? 000000001 ?
                                                   7F1D52417E00 ? 000008000 ?
                                                   000000000 ? 000000703 ?
kcc_identify_file()  call     ksfdread()           0D400A0B0 ? 000000001 ?
+309                                               7F1D52417E00 ? 000008000 ?
                                                   000000000 ? 000000703 ?
kcc_identify()+225   call     kcc_identify_file()  0D400A0B0 ? 7F1D52417E00 ?
                                                   000000000 ? 060019450 ?
                                                   060019630 ? 0DAC34670 ?
kccida()+225         call     kcc_identify()       000000000 ? 7F1D52417E00 ?
                                                   060019630 ? 7FFFB26434A4 ?
                                                   000000000 ? 0DAC34670 ?
ksbabs()+771         call     kccida()             7FFFB2643B08 ? 7F1D52417E00 ?
                                                   060019630 ? 7FFFB26434A4 ?
                                                   000000000 ? 0DAC34670 ?
ksbrdp()+971         call     ksbabs()             7FFFB2643B08 ? 7F1D52417E00 ?
                                                   060019630 ? 7FFFB26434A4 ?
                                                   000000000 ? 0DAC34670 ?

adrci> view /s01/orabase/diag/rdbms/prod/PROD1/trace/PROD1_ckpt_22504.trc

NOTE: disk 4 is missing from group 1
Incident 108831 created, dump file: /s01/orabase/diag/rdbms/prod/PROD1/incident/incdir_108831/PROD1_ckpt_22504_i108831.trc
ORA-00600: internal error code, arguments: [kfioTranslateIO03], [], [], [], [], [], [], [], [], [], [], []

=========Start of 'kfiorq = [0x7fffb2642d30]' dumping =========
        Status            =  UNKWOWN
        Flags             =  READ |  SYNC
        Mirror side       = 0
        Fib               = 0xd4f338b0
        Offset            = 1
        buffer ptr        = 0x7f1d52417e00
        Rcount            = 32768
        err_kfiorq        = 15081
        Inflight disk IO  = 0
        Completed disk IO = 0
        Oracle error      = 0
        Intended zone     = 48
  ===Dump of all attached kfiodrq's===
=========End of 'kfiorq = [0x7fffb2642d30]' dumping =========

parent :
############# kfiofib = 0xd4f338b0 #################
Diskgroup Name     =
File number        = 261.747100215
File type          = 1
Flags              = 10
Blksize            = 16384
File size          = 1131 blocks
Blk one offset     = 1
Redundancy         = 17
Physical blocksz   = 512
Open name          = +DATA/prod/controlfile/current.261.747100215
Fully-qualified nm =+DATA/prod/controlfile/current.261.747100215
Mapid             = 2
Slave ID          = -1
Connection        = 0x(nil)
############################################
Error ORA-600 signaled at ksedsts()+461<-ksf_short_stack()+77<-kge_snap_callstack()+63<-kge_sigtrace_dump()+69<-kgepop()+712<-kgersel()+175<-kfioTranslateIO()+3138<-kfi
oRqSetPrepare()+1022<-kfioSubmitIO()+2857<-kfioRequestPriv()+199<-kfioRequest()+706<-ksfd_kfioRequest()+649<-ksfd_osmio()+1055<-ksfd_io()+2722<-ksfdread()+581<-kcc_iden
tify_file()+314<-kcc_identify()+230<-kccida()+230<-ksbabs()+771<-ksbrdp()+971<-opirip()+623<-opidrv()+603<-sou2o()+103<-opimai_real()+266<-ssthrdmain()+252<-main()+201<
-__libc_start_main()+244<-_start()+36
ERROR: unrecoverable error ORA-600 raised in ASM I/O path; terminating process 22504
----- Abridged Call Stack Trace -----
ksedsts()+461<-kfioRequest()+2157<-ksfd_kfioRequest()+649<-ksfd_osmio()+1055<-ksfd_io()+2722<-ksfdread()+581<-kcc_identify_file()+314<-kcc_identify()+230<-kccida()+230<
-ksbabs()+771<-ksbrdp()+971<-opirip()+623<-opidrv()+603<-sou2o()+103<-opimai_real()+266<-ssthrdmain()+252
<-main()+201<-__libc_start_main()+244<-_start()+36 ----- End of Abridged Call Stack Trace ----- *** 2011-05-30 20:31:56.271 KSU: Terminating fatal process 'oracle@rh2.oracle.com (CKPT)' adrci> ips create package
Created package 2 without any contents, correlation level typical

adrci> ips add problem 7 package 2
Added problem 7 to package 2

adrci> ips finalize package 2
Finalized package 2

adrci> ips generate package 2 in /tmp
Generated package 2 in file /tmp/IPSPKG_20110531224208_COM_1.zip, mode complete

诊断发现由于ASM diskgroup磁盘组中的磁盘设备文件/dev/raw/raw*的权限被修改成了0600,而这些裸设备的拥有者为grid用户,导致oracle用户无法读写这些裸设备,通过将设备文件的权限修改为0660,解决了该问题。

11g新特性:A useful View V$DIAG_INFO

在11g中引入了自动诊断资料档案库(ADR)特性,默认情况下各种trace,dump存放的目录位置区别于9i/10g显得更加难以查找了。

ADR 基目录中可以包含多个 ADR 主目录,其中每个 ADR 主目录都是一个根目录,用于存放特定 Oracle 产品或组件的特定实例的全部诊断数据。前一张幻灯片的图形中显示了数据库的 ADR 主目录位置。

另外,还生成了两个预警文件。一个是文本形式的预警文件(与早期版本 Oracle DB 使用的预警文件非常相似),位于各个 ADR 主目录的 TRACE 目录下。还有一个符合 XML 标准的预警消息文件,存储在 ADR 主目录内的 ALERT 子目录下。可使用 Enterprise Manager 和 ADRCI 实用程序查看文本格式的预警日志(已删除了 XML 标记)。

此幻灯片中的图形显示了 ADR 主目录的目录结构。INCIDENT 目录包含多个子目录, 每个子目录均以特定意外事件命名,并且仅包含与该意外事件相关的转储。

HM 目录包含由健康状况监视器生成的检查器运行报告。

还有一个 METADATA 目录,其中包含资料档案库自身的重要文件。可以将此目录比作数据库字典。可使用 ADRCI 查询此字典。

ADR 命令解释器 (ADRCI) 是一个实用程序,可用于执行支持工作台允许的所有任务(但是仅限于在命令行环境中)。使用 ADRCI 实用程序,您还可以查看 ADR 中跟踪文件的名称以及删除了 XML 标记、具有和不具有内容筛选功能的预警日志。

此外,还可以使用 V$DIAG_INFO 列出一些重要的 ADR 位置。

自动诊断资料档案库 (ADR)的主要目录结构:

1.Server Directory Structure

adr1

2.Client Directory Structure

adr2

一个需要注意的细节是启用了ADR自动诊断资料档案库后,LISTENER监听器日志的默认位置也被移动到diagnostic_dest下了,而不在如9i/10g那样存放在$ORACLE_HOME/network/log目录下,有不少人因为忘记了这个细节而花费了大量时间去寻找listener.log,这个人也包括我。实际上我们还是可以将listener.log日志的位置还原回10g的形式,这一点可以通过修改$ORACLE_HOME/network/admin/listener.ora来达成:

[oracle@rh2 ~]$ cd $ORACLE_HOME/network/admin

[oracle@rh2 admin]$ cat listener.ora
# listener.ora Network Configuration File: /s01/oracle/product/11.2.0/dbhome_1/network/admin/listener.ora
# Generated by Oracle configuration tools.

LISTENER =
  (DESCRIPTION =
    (ADDRESS = (PROTOCOL = TCP)(HOST = rh2.oracle.com)(PORT = 1521))
  )

ADR_BASE_LISTENER = /s01/orabase

将以上listener.ora文件的ADR_BASE_LISTENER条目删除,并加上

DIAG_ADR_ENABLED_LISTENER = OFF

[oracle@rh2 log]$ lsnrctl reload

[oracle@rh2 admin]$ tnsping PROD
TNS Ping Utility for Linux: Version 11.2.0.2.0 - Production on 30-MAY-2011 21:39:21
Copyright (c) 1997, 2010, Oracle.  All rights reserved.
Used parameter files:
/s01/oracle/product/11.2.0/dbhome_1/network/admin/sqlnet.ora
Used TNSNAMES adapter to resolve the alias
Attempting to contact (DESCRIPTION = (ADDRESS = (PROTOCOL = TCP)(HOST = rh-cluster-scan)(PORT = 1521)) (CONNECT_DATA = (SERVER = DEDICATED) (SERVICE_NAME = PROD)))
OK (0 msec)

[oracle@rh2 log]$ cat $ORACLE_HOME/network/log/listener.log

TNSLSNR for Linux: Version 11.2.0.2.0 - Production on 30-MAY-2011 21:42:52

Copyright (c) 1991, 2010, Oracle.  All rights reserved.

System parameter file is /s01/oracle/product/11.2.0/dbhome_1/network/admin/listener.ora
Log messages written to /s01/oracle/product/11.2.0/dbhome_1/network/log/listener.log
Trace information written to /s01/oracle/product/11.2.0/dbhome_1/network/trace/listener.trc
Trace level is currently 6
Started with pid=24331
Listening on: (DESCRIPTION=(ADDRESS=(PROTOCOL=tcp)(HOST=rh2)(PORT=1521)))
Listener completed notification to CRS on start

TIMESTAMP * CONNECT DATA [* PROTOCOL INFO] * EVENT [* SID] * RETURN CODE
30-MAY-2011 21:42:53 * (CONNECT_DATA=(CID=(PROGRAM=)(HOST=rh2.oracle.com)(USER=oracle))(COMMAND=status)(ARGUMENTS=64)(SERVICE=LISTENER)(VERSION=186647040)) * status * 0
Error listening on: (DESCRIPTION=(ADDRESS=(PROTOCOL=TCP)(HOST=192.168.1.122)(PORT=1521)))
30-MAY-2011 21:42:59 * service_register * PROD1 * 12542
TNS-12542: TNS:address already in use
 TNS-12560: TNS:protocol adapter error
  TNS-00512: Address already in use
   Linux Error: 98: Address already in use
Error listening on: (DESCRIPTION=(CONNECT_DATA=(SERVICE_NAME=))(ADDRESS=(PROTOCOL=TCP)(HOST=192.168.1.133)(PORT=1521)))
30-MAY-2011 21:42:59 * service_register * PROD1 * 12542
TNS-12542: TNS:address already in use
 TNS-12560: TNS:protocol adapter error
  TNS-00512: Address already in use
   Linux Error: 98: Address already in use
30-MAY-2011 21:43:02 * service_update * PROD1 * 0
30-MAY-2011 21:43:37 * service_register * G10R2 * 0
Error listening on: (DESCRIPTION=(ADDRESS=(PROTOCOL=TCP)(HOST=192.168.1.122)(PORT=1521)))
30-MAY-2011 21:43:39 * service_register * +ASM1 * 12542
TNS-12542: TNS:address already in use
 TNS-12560: TNS:protocol adapter error
  TNS-00512: Address already in use
   Linux Error: 98: Address already in use

从以上ADR目录结构图中可以看到整个架构变得更复杂了,实际使用中的ADR档案资料库的复杂度要更高:

[grid@rh2 raw]$ tree -d  /s01/orabase/diag
/s01/orabase/diag
|-- asm
|   `-- +asm
|       `-- +ASM1
|           |-- alert
|           |-- cdump
|           |-- hm
|           |-- incident
|           |   |-- incdir_4897
|           |   |-- incdir_4898
|           |   |-- incdir_4899
|           |   |-- incdir_4900
|           |   |-- incdir_4901
|           |   |-- incdir_4902
|           |   `-- incdir_4903
|           |-- incpkg
|           |-- ir
|           |-- lck
|           |-- metadata
|           |-- metadata_dgif
|           |-- metadata_pv
|           |-- stage
|           |-- sweep
|           `-- trace
|               |-- cdmp_20110424212230
|               |-- cdmp_20110424214914
|               |-- cdmp_20110424220022
|               |-- cdmp_20110424221131
|               |-- cdmp_20110424222254
|               |-- cdmp_20110424223546
|               `-- cdmp_20110427154653
|-- clients
|   `-- user_oracle
|       `-- host_3070836769_80
|           |-- alert
|           |-- cdump
|           |-- incident
|           |-- incpkg
|           |-- lck
|           |-- metadata
|           |-- metadata_dgif
|           |-- metadata_pv
|           |-- stage
|           |-- sweep
|           `-- trace
|-- crs
|-- diagtool
|-- lsnrctl
|-- netcman
|-- ofm
|-- rdbms
|   |-- maclean
|   |   `-- MACLEAN
|   |       |-- alert
|   |       |-- cdump
|   |       |-- hm
|   |       |-- incident
|   |       |-- incpkg
|   |       |-- ir
|   |       |-- lck
|   |       |-- metadata
|   |       |-- metadata_dgif
|   |       |-- metadata_pv
|   |       |-- stage
|   |       |-- sweep
|   |       `-- trace
|   `-- prod
|       `-- PROD1
|           |-- alert
|           |-- cdump
|           |   |-- core_27975
|           |   |-- core_28006
|           |   |-- core_28013
|           |   `-- core_28034
|           |-- hm
|           |-- incident
|           |   |-- incdir_100831
|           |   |-- incdir_104831
|           |   |-- incdir_108831
|           |   |-- incdir_18201
|           |   |-- incdir_18202
|           |   |-- incdir_18266
|           |   |-- incdir_18361
|           |   |-- incdir_18362
|           |   |-- incdir_18369
|           |   |-- incdir_18385
|           |   |-- incdir_18387
|           |   |-- incdir_18393
|           |   |-- incdir_18402
|           |   |-- incdir_18410
|           |   |-- incdir_18411
|           |   |-- incdir_18441
|           |   |-- incdir_18457
|           |   |-- incdir_18458
|           |   |-- incdir_18465
|           |   |-- incdir_19737
|           |   |-- incdir_19738
|           |   |-- incdir_19739
|           |   |-- incdir_19745
|           |   |-- incdir_19746
|           |   |-- incdir_20589
|           |   |-- incdir_20701
|           |   |-- incdir_20736
|           |   |-- incdir_20737
|           |   |-- incdir_20738
|           |   |-- incdir_20739
|           |   |-- incdir_20740
|           |   |-- incdir_20957
|           |   |-- incdir_20973
|           |   |-- incdir_20989
|           |   |-- incdir_21005
|           |   |-- incdir_21778
|           |   |-- incdir_21936
|           |   |-- incdir_21937
|           |   |-- incdir_21938
|           |   |-- incdir_22200
|           |   |-- incdir_22201
|           |   |-- incdir_22216
|           |   |-- incdir_22232
|           |   |-- incdir_22233
|           |   |-- incdir_23306
|           |   |-- incdir_23506
|           |   |-- incdir_28123
|           |   |-- incdir_28147
|           |   |-- incdir_28148
|           |   |-- incdir_28227
|           |   |-- incdir_28228
|           |   |-- incdir_28229
|           |   |-- incdir_28230
|           |   |-- incdir_28235
|           |   |-- incdir_29323
|           |   |-- incdir_29324
|           |   |-- incdir_29325
|           |   |-- incdir_29326
|           |   |-- incdir_29327
|           |   |-- incdir_30681
|           |   |-- incdir_30682
|           |   |-- incdir_30683
|           |   |-- incdir_31724
|           |   |-- incdir_35253
|           |   |-- incdir_36453
|           |   |-- incdir_37653
|           |   |-- incdir_38853
|           |   |-- incdir_40053
|           |   |-- incdir_41253
|           |   |-- incdir_42453
|           |   |-- incdir_43653
|           |   |-- incdir_44853
|           |   |-- incdir_46053
|           |   |-- incdir_47253
|           |   |-- incdir_48453
|           |   |-- incdir_49653
|           |   |-- incdir_54525
|           |   |-- incdir_56918
|           |   |-- incdir_89183
|           |   |-- incdir_89184
|           |   |-- incdir_89185
|           |   |-- incdir_89186
|           |   |-- incdir_89187
|           |   |-- incdir_89327
|           |   |-- incdir_89343
|           |   |-- incdir_89351
|           |   |-- incdir_89359
|           |   |-- incdir_90270
|           |   |-- incdir_90271
|           |   |-- incdir_90272
|           |   |-- incdir_90273
|           |   |-- incdir_90274
|           |   |-- incdir_90275
|           |   `-- incdir_96831
|           |-- incpkg
|           |   `-- pkg_1
|           |       `-- seq_1
|           |           |-- crs
|           |           `-- export
|           |-- ir
|           |-- lck
|           |-- metadata
|           |-- metadata_dgif
|           |-- metadata_pv
|           |-- stage
|           |-- sweep
|           `-- trace
|               |-- cdmp_20110502214850
|               |-- cdmp_20110502214947
|               |-- cdmp_20110502221010
|               |-- cdmp_20110502221029
|               |-- cdmp_20110502221204
|               |-- cdmp_20110502221221
|               |-- cdmp_20110502221257
|               |-- cdmp_20110502221318
|               |-- cdmp_20110502221450
|               |-- cdmp_20110502221505
|               |-- cdmp_20110502222225
|               |-- cdmp_20110502222315
|               |-- cdmp_20110502222402
|               |-- cdmp_20110502224708
|               |-- cdmp_20110502230815
|               |-- cdmp_20110503202436
|               |-- cdmp_20110503202521
|               |-- cdmp_20110509231250
|               |-- cdmp_20110512171047
|               |-- cdmp_20110512171231
|               |-- cdmp_20110512171437
|               |-- cdmp_20110512171635
|               |-- cdmp_20110520165537
|               |-- cdmp_20110520232601
|               |-- cdmp_20110520234343
|               |-- cdmp_20110521000119
|               |-- cdmp_20110521000218
|               |-- cdmp_20110521065437
|               |-- cdmp_20110521065455
|               |-- cdmp_20110521065512
|               |-- cdmp_20110521074224
|               |-- cdmp_20110521074737
|               |-- cdmp_20110521075206
|               |-- cdmp_20110521080019
|               |-- cdmp_20110521080642
|               |-- cdmp_20110521140052
|               |-- cdmp_20110530202441
|               |-- cdmp_20110530202442
|               |-- cdmp_20110530202846
|               |-- cdmp_20110530202848
|               |-- cdmp_20110530202916
|               |-- cdmp_20110530202918
|               |-- cdmp_20110530203156
|               `-- cdmp_20110530203158
`-- tnslsnr
    `-- rh2
        `-- listener
            |-- alert
            |-- cdump
            |-- incident
            |-- incpkg
            |-- lck
            |-- metadata
            |-- metadata_dgif
            |-- metadata_pv
            |-- stage
            |-- sweep
            `-- trace

240 directories

所幸的是在11g中提供了比传统的gettrcname.sql脚本更为给力的诊断文件位置信息汇总的视图V$DIAG_INFO:

V$DIAG_INFO 视图列出了所有重要的 ADR 位置:
ADR Base:ADR 基目录的路径
ADR Home:当前数据库实例的 ADR 主目录的路径
Diag Trace:文本预警日志和后台/前台进程跟踪文件的位置
Diag Alert:XML 版本的预警日志的位置
Default Trace File:会话的跟踪文件的路径。SQL 跟踪文件将写入到这里。
Health Monitor: 健康检查报告所在目录
Active Problem Count:当前激活的问题总数
Active Incident Count  当前激活的事故总数

SQL>  select name,value from v$diag_info;

NAME                                    VALUE
--------------------------------------- ------------------------------------------------------------
Diag Enabled                            TRUE
ADR Base                                /s01/orabase
ADR Home                                /s01/orabase/diag/rdbms/prod/PROD1
Diag Trace                              /s01/orabase/diag/rdbms/prod/PROD1/trace
Diag Alert                              /s01/orabase/diag/rdbms/prod/PROD1/alert
Diag Incident                           /s01/orabase/diag/rdbms/prod/PROD1/incident
Diag Cdump                              /s01/orabase/diag/rdbms/prod/PROD1/cdump
Health Monitor                          /s01/orabase/diag/rdbms/prod/PROD1/hm
Default Trace File                      /s01/orabase/diag/rdbms/prod/PROD1/trace/PROD1_ora_22893.trc
Active Problem Count                    7
Active Incident Count                   373

11 rows selected.

adrci> show hm_run
**********************************************************
HM RUN RECORD 119
**********************************************************
   RUN_ID                        2481
   RUN_NAME                      HM_RUN_2481
   CHECK_NAME                    DB Structure Integrity Check
   NAME_ID                       2
   MODE                          2
   START_TIME                    2011-05-21 20:11:38.612669 +08:00
   RESUME_TIME
   END_TIME                      2011-05-21 20:11:38.619530 +08:00
   MODIFIED_TIME                 2011-05-21 20:11:38.619530 +08:00
   TIMEOUT                       0
   FLAGS                         0
   STATUS                        5
   SRC_INCIDENT_ID               0
   NUM_INCIDENTS                 0
   ERR_NUMBER                    0
   REPORT_FILE                   

adrci> create report hm_run HM_RUN_2481

adrci> show hm_run  -p "RUN_ID=2481"

ADR Home = /s01/orabase/diag/rdbms/prod/PROD1:
*************************************************************************

**********************************************************
HM RUN RECORD 1
**********************************************************
   RUN_ID                        2481
   RUN_NAME                      HM_RUN_2481
   CHECK_NAME                    DB Structure Integrity Check
   NAME_ID                       2
   MODE                          2
   START_TIME                    2011-05-21 20:11:38.612669 +08:00
   RESUME_TIME
   END_TIME                      2011-05-21 20:11:38.619530 +08:00
   MODIFIED_TIME                 2011-05-30 21:09:43.071150 +08:00
   TIMEOUT                       0
   FLAGS                         0
   STATUS                        5
   SRC_INCIDENT_ID               0
   NUM_INCIDENTS                 0
   ERR_NUMBER                    0
   REPORT_FILE                   /s01/orabase/diag/rdbms/prod/PROD1/hm/HMREPORT_HM_RUN_2481.hm

[oracle@rh2 ~]$ cd /s01/orabase/diag/rdbms/prod/PROD1/hm

[oracle@rh2 hm]$ cat HMREPORT_HM_RUN_2481.hm

<?xml version="1.0" encoding="US-ASCII"?>
<HM-REPORT REPORT_ID="HM_RUN_2481">
 <TITLE>HM Report: HM_RUN_2481</TITLE>
 <RUN_INFO>
 <CHECK_NAME>DB Structure Integrity Check</CHECK_NAME>
 <RUN_ID>2481</RUN_ID>
 <RUN_NAME>HM_RUN_2481</RUN_NAME>
 <RUN_MODE>REACTIVE</RUN_MODE>
 <RUN_STATUS>COMPLETED</RUN_STATUS>
 <RUN_ERROR_NUM>0</RUN_ERROR_NUM>
 <SOURCE_INCIDENT_ID>0</SOURCE_INCIDENT_ID>
 <NUM_INCIDENTS_CREATED>0</NUM_INCIDENTS_CREATED>
 <RUN_START_TIME>2011-05-21 20:11:38.612669 +08:00</RUN_START_TIME>
 <RUN_END_TIME>2011-05-21 20:11:38.619530 +08:00</RUN_END_TIME>
 </RUN_INFO>
 <RUN_PARAMETERS/>
 <RUN-FINDINGS/>
</HM-REPORT>

通过查询V$diag_info可以很容易找到自身服务进程的trace文件位置,对于其他进程的trace文件则可以查询v$process新加入的tracefile列:

SQL> select spid,tracefile from v$process;

SPID                     TRACEFILE
------------------------ --------------------------------------------------------------------------------
                         /s01/orabase/diag/rdbms/prod/PROD1/trace/PROD1_ora_0.trc
22789                    /s01/orabase/diag/rdbms/prod/PROD1/trace/PROD1_pmon_22789.trc
22791                    /s01/orabase/diag/rdbms/prod/PROD1/trace/PROD1_psp0_22791.trc

crsctl status resource -t -init in 11.2.0.2 grid infrastructure

11.2.0.2的grid infrastructure中crsctl stat res 命令不再显示如ora.cssd、ora.ctssd、ora.diskmon等基础资源的信息,如果用户想要了解这些resource状态需要加上-init选项:

[grid@rh2 ~]$ crsctl query crs activeversion
Oracle Clusterware active version on the cluster is [11.2.0.2.0]

[grid@rh2 ~]$ crsctl stat res -t
--------------------------------------------------------------------------------
NAME           TARGET  STATE        SERVER                   STATE_DETAILS
--------------------------------------------------------------------------------
Local Resources
--------------------------------------------------------------------------------
ora.DATA.dg
               ONLINE  ONLINE       rh2
ora.LISTENER.lsnr
               OFFLINE OFFLINE      rh2
ora.asm
               ONLINE  ONLINE       rh2
ora.gsd
               OFFLINE OFFLINE      rh2
ora.net1.network
               ONLINE  ONLINE       rh2
ora.ons
               ONLINE  ONLINE       rh2
ora.registry.acfs
               OFFLINE OFFLINE      rh2
--------------------------------------------------------------------------------
Cluster Resources
--------------------------------------------------------------------------------
ora.LISTENER_SCAN1.lsnr
      1        OFFLINE OFFLINE
ora.cvu
      1        OFFLINE OFFLINE
ora.dw.db
      1        OFFLINE OFFLINE
ora.maclean.db
      1        OFFLINE OFFLINE
ora.oc4j
      1        OFFLINE OFFLINE
ora.prod.db
      1        OFFLINE OFFLINE
      2        OFFLINE OFFLINE
ora.prod.maclean.svc
      1        OFFLINE OFFLINE
      2        OFFLINE OFFLINE
ora.prod.maclean_pre.svc
      1        OFFLINE OFFLINE
      2        OFFLINE OFFLINE
ora.prod.maclean_pre_preconnect.svc
      1        OFFLINE OFFLINE
ora.prod.maclean_taf.svc
      1        OFFLINE OFFLINE
      2        OFFLINE OFFLINE
ora.rh2.vip
      1        OFFLINE OFFLINE
ora.rh3.vip
      1        OFFLINE OFFLINE
ora.scan1.vip
      1        OFFLINE OFFLINE                                       

[grid@rh2 ~]$ crsctl stat res -t -init 
--------------------------------------------------------------------------------
NAME           TARGET  STATE        SERVER                   STATE_DETAILS
--------------------------------------------------------------------------------
Cluster Resources
--------------------------------------------------------------------------------
ora.asm
      1        ONLINE  ONLINE       rh2                      Started
ora.cluster_interconnect.haip
      1        ONLINE  ONLINE       rh2
ora.crf
      1        ONLINE  ONLINE       rh2
ora.crsd
      1        ONLINE  ONLINE       rh2
ora.cssd
      1        ONLINE  ONLINE       rh2
ora.cssdmonitor
      1        ONLINE  ONLINE       rh2
ora.ctssd
      1        ONLINE  ONLINE       rh2                      OBSERVER
ora.diskmon
      1        ONLINE  ONLINE       rh2
ora.drivers.acfs
      1        ONLINE  OFFLINE
ora.evmd
      1        ONLINE  ONLINE       rh2
ora.gipcd
      1        ONLINE  ONLINE       rh2
ora.gpnpd
      1        ONLINE  ONLINE       rh2
ora.mdnsd
      1        ONLINE  ONLINE       rh2

此外在11.2.0.2的grid中当我们想启动、停止、修改这些init资源时都需要加上-init选项,否则将出现CRS-2613: Could not find resource错误:

[grid@rh2 ~]$ crsctl stat res ora.asm
NAME=ora.asm
TYPE=ora.asm.type
TARGET=ONLINE
STATE=ONLINE on rh2

[grid@rh2 ~]$ crsctl modify res ora.asm -attr AUTO_START=never

[grid@rh2 ~]$ crsctl stat res ora.asm -p
NAME=ora.asm
TYPE=ora.asm.type
ACL=owner:grid:rwx,pgrp:oinstall:rwx,other::r--
ACTION_FAILURE_TEMPLATE=
ACTION_SCRIPT=
AGENT_FILENAME=%CRS_HOME%/bin/oraagent%CRS_EXE_SUFFIX%
ALIAS_NAME=ora.%CRS_CSS_NODENAME%.ASM%CRS_CSS_NODENUMBER%.asm
AUTO_START=never
CHECK_INTERVAL=60
CHECK_TIMEOUT=30
DEFAULT_TEMPLATE=PROPERTY(RESOURCE_CLASS=asm) ELEMENT(INSTANCE_NAME= %GEN_USR_ORA_INST_NAME%)
DEGREE=1
DESCRIPTION=Oracle ASM resource
ENABLED=1
GEN_USR_ORA_INST_NAME=
GEN_USR_ORA_INST_NAME@SERVERNAME(rh2)=+ASM1
GEN_USR_ORA_INST_NAME@SERVERNAME(rh3)=+ASM2
LOAD=1
LOGGING_LEVEL=1
NLS_LANG=
NOT_RESTARTING_TEMPLATE=
OFFLINE_CHECK_INTERVAL=0
PROFILE_CHANGE_TEMPLATE=
RESTART_ATTEMPTS=5
SCRIPT_TIMEOUT=60
START_DEPENDENCIES=weak(ora.LISTENER.lsnr)
START_TIMEOUT=900
STATE_CHANGE_TEMPLATE=
STOP_DEPENDENCIES=
STOP_TIMEOUT=600
TYPE_VERSION=1.2
UPTIME_THRESHOLD=1d
USR_ORA_ENV=
USR_ORA_INST_NAME=+ASM%CRS_CSS_NODENUMBER%
USR_ORA_OPEN_MODE=mount
USR_ORA_OPI=false
USR_ORA_STOP_MODE=immediate
VERSION=11.2.0.2.0

[grid@rh2 ~]$ crsctl status resource  -init -t|grep -v ONLINE|tail -13
ora.asm
ora.cluster_interconnect.haip
ora.crf
ora.crsd
ora.cssd
ora.cssdmonitor
ora.ctssd
ora.diskmon
ora.drivers.acfs
ora.evmd
ora.gipcd
ora.gpnpd
ora.mdnsd

[grid@rh2 ~]$ crsctl status resource  -init -t|grep -v ONLINE|tail -13|xargs crsctl status resource
CRS-2613: Could not find resource 'ora.cluster_interconnect.haip'.
CRS-2613: Could not find resource 'ora.crf'.
CRS-2613: Could not find resource 'ora.crsd'.
CRS-2613: Could not find resource 'ora.cssd'.
CRS-2613: Could not find resource 'ora.cssdmonitor'.
CRS-2613: Could not find resource 'ora.ctssd'.
CRS-2613: Could not find resource 'ora.diskmon'.
CRS-2613: Could not find resource 'ora.drivers.acfs'.
CRS-2613: Could not find resource 'ora.evmd'.
CRS-2613: Could not find resource 'ora.gipcd'.
CRS-2613: Could not find resource 'ora.gpnpd'.
CRS-2613: Could not find resource 'ora.mdnsd'.
NAME=ora.asm
TYPE=ora.asm.type
TARGET=ONLINE
STATE=ONLINE on rh2

[grid@rh2 ~]$ crsctl status res ora.crsd -init -p
NAME=ora.crsd
TYPE=ora.crs.type
ACL=owner:root:rw-,pgrp:oinstall:rw-,other::r--,user:grid:r-x
ACTION_FAILURE_TEMPLATE=
ACTION_SCRIPT=
ACTIVE_PLACEMENT=0
AGENT_FILENAME=%CRS_HOME%/bin/orarootagent%CRS_EXE_SUFFIX%
AUTO_START=always
CARDINALITY=1
CHECK_ARGS=
CHECK_COMMAND=
CHECK_INTERVAL=30
CLEAN_ARGS=
CLEAN_COMMAND=
DAEMON_LOGGING_LEVELS=AGENT=1,AGFW=0,CLSFRAME=0,CLSVER=0,CLUCLS=0,COMMCRS=0,COMMNS=0,CRSAPP=0,CRSCCL=0,CRSCEVT=0,CRSCOMM=0,CRSD=0,CRSEVT=0,CRSMAIN=0,CRSOCR=0,CRSPE=0,CRSPLACE=0,CRSRES=0,CRSRPT=0,CRSRTI=0,CRSSE=0,CRSSEC=0,CRSTIMER=0,CRSUI=0,CSSCLNT=0,SuiteTes=1,UiServer=0,OCRAPI=1,OCRCLI=1,OCRSRV=1,OCRMAS=1,OCRMSG=1,OCRCAC=1,OCRRAW=1,OCRUTL=1,OCROSD=1,OCRASM=1
DAEMON_TRACING_LEVELS=AGENT=0,AGFW=0,CLSFRAME=0,CLSVER=0,CLUCLS=0,COMMCRS=0,COMMNS=0,CRSAPP=0,CRSCCL=0,CRSCEVT=0,CRSCOMM=0,CRSD=0,CRSEVT=0,CRSMAIN=0,CRSOCR=0,CRSPE=0,CRSPLACE=0,CRSRES=0,CRSRPT=0,CRSRTI=0,CRSSE=0,CRSSEC=0,CRSTIMER=0,CRSUI=0,CSSCLNT=0,SuiteTes=0,UiServer=0,OCRAPI=1,OCRCLI=1,OCRSRV=1,OCRMAS=1,OCRMSG=1,OCRCAC=1,OCRRAW=1,OCRUTL=1,OCROSD=1,OCRASM=1
DEFAULT_TEMPLATE=
DEGREE=1
DESCRIPTION="Resource type for CRSD"
DETACHED=true
ENABLED=1
FAILOVER_DELAY=0
FAILURE_INTERVAL=3
FAILURE_THRESHOLD=5
HOSTING_MEMBERS=
LOAD=1
LOGGING_LEVEL=1
NOT_RESTARTING_TEMPLATE=
OFFLINE_CHECK_INTERVAL=0
ORA_VERSION=11.2.0.2.0
PID_FILE=
PLACEMENT=balanced
PROCESS_TO_MONITOR=
PROFILE_CHANGE_TEMPLATE=
RESTART_ATTEMPTS=10
SCRIPT_TIMEOUT=60
SERVER_POOLS=
START_ARGS=
START_COMMAND=
START_DEPENDENCIES=hard(ora.asm,ora.cssd,ora.ctssd,ora.gipcd)pullup(ora.asm,ora.cssd,ora.ctssd,ora.gipcd)
START_TIMEOUT=600
STATE_CHANGE_TEMPLATE=
STOP_ARGS=
STOP_COMMAND=
STOP_DEPENDENCIES=hard(shutdown:ora.asm,intermediate:ora.cssd,intermediate:ora.gipcd)
STOP_MODE=NONE
STOP_TIMEOUT=43200
UPTIME_THRESHOLD=1m
USR_ORA_ENV=

[grid@rh2 ~]$ crsctl modify res ora.crsd -init -attr "SCRIPT_TIMEOUT"=65   
CRS-0245:  User doesn't have enough privilege to perform the operation
CRS-4000: Command Modify failed, or completed with errors.

/* 修改某些资源的属性要求root权限 */

[root@rh2 ~]# crsctl modify res ora.crsd -init -attr "SCRIPT_TIMEOUT"=65 

[root@rh2 ~]# crsctl status res ora.crsd -init -p|grep SCRIPT_TIMEOUT
SCRIPT_TIMEOUT=65

[root@rh2 ~]# crsctl status res ora.ctssd -p -init
NAME=ora.ctssd
TYPE=ora.ctss.type
ACL=owner:root:rw-,pgrp:oinstall:rw-,other::r--,user:grid:r-x
ACTION_FAILURE_TEMPLATE=
ACTION_SCRIPT=
ACTIVE_PLACEMENT=0
AGENT_FILENAME=%CRS_HOME%/bin/orarootagent%CRS_EXE_SUFFIX%
AUTO_START=always
CARDINALITY=1
CHECK_ARGS=
CHECK_COMMAND=
CHECK_INTERVAL=30
CLEAN_ARGS=
CLEAN_COMMAND=
DAEMON_LOGGING_LEVELS=CLUCLS=0,CSSCLNT=0,CRSCCL=1,CTSS=5,OCRAPI=1,OCRCLI=1,OCRMSG=1
DAEMON_TRACING_LEVELS=CLUCLS=0,CSSCLNT=0,CRSCCL=1,CTSS=5,OCRAPI=1,OCRCLI=1,OCRMSG=1
DEFAULT_TEMPLATE=
DEGREE=1
DESCRIPTION="Resource type for Ctss Agents"
DETACHED=true
ENABLED=1
FAILOVER_DELAY=0
FAILURE_INTERVAL=3
FAILURE_THRESHOLD=5
HOSTING_MEMBERS=
LOAD=1
LOGGING_LEVEL=1
NOT_RESTARTING_TEMPLATE=
OFFLINE_CHECK_INTERVAL=0
ORA_VERSION=11.2.0.2.0
PID_FILE=
PLACEMENT=balanced
PROCESS_TO_MONITOR=
PROFILE_CHANGE_TEMPLATE=
RESTART_ATTEMPTS=5
SCRIPT_TIMEOUT=60
SERVER_POOLS=
START_ARGS=
START_COMMAND=
START_DEPENDENCIES=hard(ora.cssd,ora.gipcd)pullup(ora.cssd,ora.gipcd)
START_TIMEOUT=60
STATE_CHANGE_TEMPLATE=
STOP_ARGS=
STOP_COMMAND=
STOP_DEPENDENCIES=hard(ora.cssd,ora.gipcd)
STOP_TIMEOUT=60
UPTIME_THRESHOLD=1m
USR_ORA_ENV=

[root@rh2 ~]# crsctl status res ora.diskmon -p -init
NAME=ora.diskmon
TYPE=ora.diskmon.type
ACL=owner:root:rw-,pgrp:oinstall:rw-,other::r--,user:grid:r-x
ACTION_FAILURE_TEMPLATE=
ACTION_SCRIPT=
ACTIVE_PLACEMENT=0
AGENT_FILENAME=%CRS_HOME%/bin/orarootagent%CRS_EXE_SUFFIX%
AUTO_START=never
CARDINALITY=1
CHECK_ARGS=
CHECK_COMMAND=
CHECK_INTERVAL=3
CHECK_TIMEOUT=30
CLEAN_ARGS=
CLEAN_COMMAND=
DAEMON_LOGGING_LEVELS=
DAEMON_TRACING_LEVELS=
DEFAULT_TEMPLATE=
DEGREE=1
DESCRIPTION="Resource type for Diskmon"
DETACHED=true
ENABLED=1
FAILOVER_DELAY=0
FAILURE_INTERVAL=3
FAILURE_THRESHOLD=5
HOSTING_MEMBERS=
LOAD=1
LOGGING_LEVEL=1
NOT_RESTARTING_TEMPLATE=
OFFLINE_CHECK_INTERVAL=0
ORA_VERSION=11.2.0.2.0
PID_FILE=
PLACEMENT=balanced
PROCESS_TO_MONITOR=
PROFILE_CHANGE_TEMPLATE=
RESTART_ATTEMPTS=10
SCRIPT_TIMEOUT=60
SERVER_POOLS=
START_ARGS=
START_COMMAND=
START_DEPENDENCIES=weak(concurrent:ora.cssd)pullup:always(ora.cssd)
START_TIMEOUT=600
STATE_CHANGE_TEMPLATE=
STOP_ARGS=
STOP_COMMAND=
STOP_DEPENDENCIES=
STOP_TIMEOUT=60
UPTIME_THRESHOLD=5s
USR_ORA_ENV=ORACLE_USER=grid
VERSION=11.2.0.2.0

[root@rh2 ~]# crsctl status res ora.cssd -init -p
NAME=ora.cssd
TYPE=ora.cssd.type
ACL=owner:root:rw-,pgrp:oinstall:rw-,other::r--,user:grid:r-x
ACTION_FAILURE_TEMPLATE=
ACTION_SCRIPT=
ACTIVE_PLACEMENT=0
AGENT_FILENAME=%CRS_HOME%/bin/cssdagent%CRS_EXE_SUFFIX%
AGENT_HB_INTERVAL=0
AGENT_HB_MISCOUNT=10
AUTO_START=always
CARDINALITY=1
CHECK_ARGS=
CHECK_COMMAND=
CHECK_INTERVAL=30
CLEAN_ARGS=abort
CLEAN_COMMAND=
CSSD_MODE=
CSSD_PATH=%CRS_HOME%/bin/ocssd%CRS_EXE_SUFFIX%
CSS_USER=grid
DAEMON_LOGGING_LEVELS=CSSD=2,GIPCNM=2,GIPCGM=2,GIPCCM=2,CLSF=0,SKGFD=0,GPNP=1,OLR=0
DAEMON_TRACING_LEVELS=CSSD=0,GIPCNM=0,GIPCGM=0,GIPCCM=0,CLSF=0,SKGFD=0,GPNP=0,OLR=0
DEFAULT_TEMPLATE=
DEGREE=1
DESCRIPTION="Resource type for CSSD"
DETACHED=true
ENABLED=1
ENV_OPTS=
FAILOVER_DELAY=0
FAILURE_INTERVAL=3
FAILURE_THRESHOLD=5
HOSTING_MEMBERS=
LOAD=1
LOGGING_LEVEL=1
NOT_RESTARTING_TEMPLATE=
OFFLINE_CHECK_INTERVAL=0
OMON_INITRATE=1000
OMON_POLLRATE=500
ORA_OPROCD_MODE=
ORA_VERSION=11.2.0.2.0
PID_FILE=
PLACEMENT=balanced
PROCD_TIMEOUT=1000
PROCESS_TO_MONITOR=
PROFILE_CHANGE_TEMPLATE=
RESTART_ATTEMPTS=3
SCRIPT_TIMEOUT=600
SERVER_POOLS=
START_ARGS=
START_COMMAND=
START_DEPENDENCIES=weak(concurrent:ora.diskmon)hard(ora.cssdmonitor,ora.gpnpd,ora.gipcd)pullup(ora.gpnpd,ora.gipcd)
START_TIMEOUT=600
STATE_CHANGE_TEMPLATE=
STOP_ARGS=
STOP_COMMAND=
STOP_DEPENDENCIES=hard(intermediate:ora.gipcd,shutdown:ora.diskmon,intermediate:ora.cssdmonitor)
STOP_TIMEOUT=900
UPTIME_THRESHOLD=1m
USR_ORA_ENV=
VMON_INITLIMIT=16
VMON_INITRATE=500
VMON_POLLRATE=500

How does SGA/PGA allocate on AMM?

Oracle 11g中引入了革命性的Automatic Memory Management(AMM)特性,通过该特性DBA只需要为Instance指定一个参数(memory_target),数据库软件就会根据SGA/PGA内存的实际使用统计信息来调优SGA/PGA内存区域的大小。从技术上说这是一个很cool的特性,可以说是Oracle所提倡的self_tuned即自身调优数据库软件大成的一个标志。但从另一方面来看,AMM也会给我们带来不少问题和困惑,DBA需要面对更多黑盒内隐藏的秘密了。

虽然我们无法彻底了解AMM的所有细节,但有一些关键性问题肯定会在我们使用AMM的过程造成许多的不确定性,在此我列出部分问题及其解答。

Question1:在使用AMM特性时,即设置了memory_target的情况下sga/pga内存区域默认各占百分之多少?

Answer:
这个问题存在多种不同的情景:

1)设置memory_target的同时,设置了sga_target及pga_aggregate_target参数:这种情况下设置的sga_target与pga_aggregate_target之和不能大于memory_target;默认sga大小等同于sga_target设定的值,可以从V$memory_Dynamic_Components视图中查询到pga target的current size可能远大于pga_aggregate_target(这里查询出来的current size仅代表pga的一个目标值,不是pga当前实际占用的内存),一般来说这里的pga current size等于(memory_target-sga_target),显然pga target的最小值会是pga_aggregate_target,而sga的最小值为sga_target.在此前提下sga/pga内存区域有较小的灵活性,实际上仅当memory_target>sga_target+pga_aggregate_target的情况下,sga/pga才可能发生扩展(grow)和收缩(shrink)

2)设置memory_target的同时,设置了sga_target而未设置pga_aggregate_target参数:这种情况下Oracle会自动调优以上2个参数,pga_aggregate_target的初始值为(memory_target-sga_target),注意这里说的是初始值;这种情况下因为没有硬性地设置pga_aggregate_target,故而sga/pga内存区域有较大的灵活性去扩展(grow)和收缩(shrink)。更倾向于sga的扩展,当然这并不绝对。

3)设置memory_target的同时,设置了pga_aggregate_target而未设置sga_target:这种情况下Oracle会自动调优以上2个参数,sga_target的初始值为min(memory_target-pga_aggregate_target,sga_max_size),注意这里说的是初始值;类似于以上的情况因为没有硬性地设置sga_target,故而sga/pga内存区域有较大的灵活性去扩展(grow)和收缩(shrink)。更倾向于pga的扩展,当然这并不绝对。

4)仅仅设置了memory_target参数,Oracle会自动调优sga/pga内存区域,且没有任何最小值或默认值的约束。当在初始化分配操作系统内存的时候存在一个分配pga/sga的策略;该策略会在实例启动阶段(instance startup)为SGA分配memory_target 60%的内存(该比例受到隐藏参数_memory_initial_sga_split_perc Initial default sga target percentage with memory target的影响,该参数默认为60),而为PGA分配40%的内存。这种情况下sga/pga内存区域的游标最为灵活,可以不受限制地上下浮动,是真正意义上的AMM,但也最为危险!

5)没有设置memory_target参数,该情况下Oracle 11g的表现与10g中”一致”(并非完全一致,黑盒中藏了很多秘密,只是看上去这样,后面会提到)

Question2:”我在10g就感到ASMM很不好用,产生了很多问题;我是个保守派,对11g中的AMM一定也不感兴趣。我要彻底禁用AMM和ASMM,在11g中是否只要设置sga_target和memory_target参数为零就ok了?”

Answer:
在11.2.0.1之前的版本(包括11.1.0.7,11.1.0.6等)我们仅需要设置sga_target和memory_target参数为零就可以避免sga/pga内存区域的resize,但在Oracle 11g Release 2中引入了immediate memory allocation requests立即内存分配的特性,该特性会在automatic memory management被禁用的情况下始终生效,引入这一特性的直接目的是尽可能的避免ORA-04031错误的发生,一般来说该特性更多地表现出了其积极的一面,但如果你实际需要的是一块安宁的、如死水寂静的sga/pga内存区域的话,我们还是有办法禁用该immediate memory allocation requests特性的,这样可以彻底杜绝sga中内存组建resize的发生:

SQL> col DESCRIB for a60
SQL> set linesize 200 pagesize 2000
SQL> col name for a32
SQL> col value for a10

SQL> SELECT x.ksppinm NAME, y.ksppstvl VALUE, x.ksppdesc describ
  2   FROM SYS.x$ksppi x, SYS.x$ksppcv y
  3   WHERE x.inst_id = USERENV ('Instance')
  4   AND y.inst_id = USERENV ('Instance')
  5   AND x.indx = y.indx
  6  AND x.ksppinm LIKE '%_memory_imm_mode_without_autosga%';

NAME                             VALUE      DESCRIB
-------------------------------- ---------- ------------------------------------------------------------
_memory_imm_mode_without_autosga TRUE       Allow immediate mode without sga/memory target

SQL> alter system set "_memory_imm_mode_without_autosga"=FALSE scope=both;
System altered.

/* 修改该参数需要重启实例 !*/

Question3:”我是一个激进派,我喜欢Oracle self-tuned自动调优的种种特性,为了充分利用AMM的优势,我决定仅设置memory_target参数,而不设置sga_target和pga_aggregate_target参数,让Oracle自行去调优这2个参数。但是我有担心如果pga扩展过头,是不是可能造成sga频繁shrink,造成系统颠簸甚至实例hang住?”

Answer:你的担心是完全有理由的,已知的文档604080.1指出了在11.1.0.6到11.1.0.7版本中存在AMM下未设置PGA_AGGREGATE_TARGET导致Oracle所使用的总内存超过MEMORY_MAX_TARGET的bug 6346293(When not setting PGA_AGGREGATE_TARGET to an explicit value, MEMORY_MAX_TARGET can be exceeded)。该Bug在11.2以上版本中得到了修复。

显然通过R1多个版本的历练后,Oracle充分认识到了AMM”自由调度”所可能带来的问题,我相信Oracle已经得到了某些内存阀值的黄金比例(Another magic number),当然这些幻数隐藏得很深(可能由某个_memory开头的隐藏参数控制着,但我没有兴致去研究,这需要花费太多的时间)。通过这些经典阀值Oracle可以有效控制pga/sga在不过度扩展或收缩的情况下仍保留其灵活性。

针对那些和我一样热爱新特性的朋友,最好的建议可能是在设置memory_target的同时为sga_target、pga_aggregate_target设置最小的期望值:

Memory_Max_Target>=Memory_Target>>(Sga_Target+Pga_Aggregate_Target)

这样可以避免由AMM过于活跃所造成的系统颠簸,而又不失去其灵活性。

to be continued………….

解决Linux上11g的ORA-00845错误

下午想把一个11.2.0.2实例的memory_target AMM内存初始化参数修改到2000M,改好后重启发现实例起不来了,出现了ORA-00845错误:

[oracle@rh2 ~]$ 
[oracle@rh2 ~]$ sqlplus  / as sysdba

SQL*Plus: Release 11.2.0.2.0 Production on Tue May 3 19:43:50 2011

Copyright (c) 1982, 2010, Oracle.  All rights reserved.

Connected to an idle instance.

SQL> startup nomount;
ORA-00845: MEMORY_TARGET not supported on this system

======================= ALERT.LOG======================

Starting ORACLE instance (normal)
WARNING: You are trying to use the MEMORY_TARGET feature. 
This feature requires the /dev/shm file system to be mounted for at least 2097152000 bytes. 
/dev/shm is either not mounted or is mounted with available space less than this size. 
Please fix this so that MEMORY_TARGET can work as expected. 
Current available is 1871466496 and used is 200790016 bytes. 
Ensure that the mount point is /dev/shm for this directory.
memory_target needs larger /dev/shm

看起来是因为采用了Automatic Memory Management的特性,所以Oracle采用了一种基于POSIX的共享内存使用风格,在AMM中Oracle不像之前版本那样利用”一整块”内存作为SGA,而是使用一块块小的”chunk”,以满足SGA与PGA之前交换内存的目的,具体可以参考下图:
AMM1

针对上述ORA-00845错误,我们需要修改映射内存文件夹/dev/shm的装载参数,针对正在运行的Linux操作系统,可以remount这个tmpfs装载点,如:

[root@rh2 ~]# umount /dev/shm
umount: /dev/shm: device is busy

[root@rh2 ~]# ls /dev/shm
JOXSHM_EXT_0_PROD1_8323079   JOXSHM_EXT_25_PROD1_8323079  ora_+ASM1_7569414_11  
JOXSHM_EXT_10_PROD1_8323079  JOXSHM_EXT_26_PROD1_8323079  ora_+ASM1_7569414_12  
............

/* 可以看到如果ASM实例也使用AMM的话同样会在/dev/shm目录下产生内存映像 
    为了umount该装载点,我们不得不首先shutdown ASM instance ! */

[root@rh2 ~]# su - grid
[grid@rh2 ~]$ sqlplus  / as sysdba

SQL*Plus: Release 11.2.0.2.0 Production on Tue May 3 20:05:24 2011

Copyright (c) 1982, 2010, Oracle.  All rights reserved.

Connected to:
Oracle Database 11g Enterprise Edition Release 11.2.0.2.0 - 64bit Production
With the Real Application Clusters and Automatic Storage Management options

SQL> shutdown immediate;
ORA-01031: insufficient privileges
SQL> exit
Disconnected from Oracle Database 11g Enterprise Edition Release 11.2.0.2.0 - 64bit Production
With the Real Application Clusters and Automatic Storage Management options
[grid@rh2 ~]$ sqlplus  / as sysasm

SQL*Plus: Release 11.2.0.2.0 Production on Tue May 3 20:05:32 2011

Copyright (c) 1982, 2010, Oracle.  All rights reserved.

Connected to:
Oracle Database 11g Enterprise Edition Release 11.2.0.2.0 - 64bit Production
With the Real Application Clusters and Automatic Storage Management options

SQL> shutdown immediate;
ORA-15097: cannot SHUTDOWN ASM instance with connected client (process 1576)
SQL> shutdown abort;
ASM instance shutdown
SQL> exit
Disconnected from Oracle Database 11g Enterprise Edition Release 11.2.0.2.0 - 64bit Production
With the Real Application Clusters and Automatic Storage Management options

[root@rh2 ~]# umount /dev/shm

[root@rh2 ~]# mount -t tmpfs shmfs -o size=4000m /dev/shm

/* 这里的size指定了shm目录的装载大小,4000m可能对你的系统仍然不够,
    那么你有理由设一个更大的值  */


[root@rh2 ~]# mount|grep shmfs
shmfs on /dev/shm type tmpfs (rw,size=4000m)

Startup ASM...........

[root@rh2 ~]# su - oracle
[oracle@rh2 ~]$ sqlplus  / as sysdba

SQL*Plus: Release 11.2.0.2.0 Production on Tue May 3 20:09:40 2011

Copyright (c) 1982, 2010, Oracle.  All rights reserved.

Connected to an idle instance.

SQL> startup nomount;
ORACLE instance started.

Total System Global Area 2087780352 bytes
Fixed Size                  2228072 bytes
Variable Size            1476395160 bytes
Database Buffers          603979776 bytes
Redo Buffers                5177344 bytes

/* 实例启动成功! */

上述umount/mount的方式只在操作系统的此次生命周期中生效,如果重启的话shmfs目录仍会以默认方式装载;如果需要永久生效的话,我们需要修改系统参数文件/etc/fstab中的shm条目:

/* 修改前的shm装载参数 */

[root@rh2 ~]# grep shm /etc/fstab 
tmpfs                   /dev/shm                tmpfs   defaults        0 0

/* 修改后的shm装载参数 */

[root@rh2 ~]# grep shm /etc/fstab 
tmpfs                   /dev/shm                tmpfs   rw,size=4000m   0 0

解决UDE-31623错误一例

一套Linux x86-64上的11.2.0.2数据库在使用data pump数据泵expdp工具导出时遭遇了ORA-31623错误,详细日志如下:

[oracle@rh2 dbs]$ expdp system/password dumpfile=s01:sh.dmp schemas=sh

Export: Release 11.2.0.2.0 - Production on Mon May 2 22:46:57 2011

Copyright (c) 1982, 2009, Oracle and/or its affiliates.  All rights reserved.

Connected to: Oracle Database 11g Enterprise Edition Release 11.2.0.2.0 - 64bit Production
With the Partitioning, Real Application Clusters, Automatic Storage Management, OLAP,
Data Mining and Real Application Testing options

UDE-31623: operation generated ORACLE error 31623
ORA-31623: a job is not attached to this session via the specified handle
ORA-06512: at "SYS.DBMS_DATAPUMP", line 3326
ORA-06512: at "SYS.DBMS_DATAPUMP", line 4551
ORA-06512: at line 1

/* 伴随以上ORA-31623错误在告警日志中出现了以下记录 */

2011-05-02 22:47:05.792000 +08:00
Errors in file /s01/orabase/diag/rdbms/prod/PROD1/trace/PROD1_ora_22060.trc  (incident=54525):
ORA-04031: unable to allocate 56 bytes of shared memory 
("streams pool","unknown object","streams pool","fixed allocation callback")
Incident details in: /s01/orabase/diag/rdbms/prod/PROD1/incident/incdir_54525/PROD1_ora_22060_i54525.trc
2011-05-02 22:47:08.189000 +08:00
Use ADRCI or Support Workbench to package the incident.
See Note 411.1 at My Oracle Support for error and packaging details.
Dumping diagnostic data in directory=[cdmp_20110502224708], requested by (instance=1, osid=22060), summary=[incident=54525].
2011-05-02 22:47:10.502000 +08:00
Sweep [inc][54525]: completed
Sweep [inc2][54525]: completed

SQL> show parameter memory

NAME                                 TYPE        VALUE
------------------------------------ ----------- ------------------------------
hi_shared_memory_address             integer     0
memory_max_target                    big integer 912M
memory_target                        big integer 912M
shared_memory_address                integer     0

从以上日志可以看到导出进程在为”fixed allocation callback”从streams pool流池中分配内存时遇到了ORA-04031错误,进而导致了UDE-31623错误。为什么expdp要从streams pool中分配内存呢?data pump数据泵在11g中开始Advanced Queue高级队列来控制其job作业的启动、停止和重启了。如果streams pool的当前size为0,那么显然无法分配到任何内存;而当前系统中就只设置了AMM特性的memory_target内存参数,并没有显式地设置streams_pool_size参数,这就导致了问题的发生。
我们可以通过上症状在MOS上搜索可以找到Note”UDE-31623 Error with Data Pump Export”:

Applies to:

Oracle Server - Enterprise Edition - Version: 11.2.0.0. and later   [Release: 11.2 and later ]
Information in this document applies to any platform.
Goal

Data Pump Export does not start:

$ expdp system/ directory=test dumpfile=system.dmp logfile=abcd.log full=y

Export: Release 11.2.0.1.0 - Production on Thu Mar 25 12:11:31 2010

Copyright (c) 1982, 2009, Oracle and/or its affiliates.  All rights reserved.

Connected to: Oracle Database 11g Enterprise Edition Release 11.2.0.1.0 - Production
With the Partitioning, OLAP, Data Mining and Real Application Testing options

UDE-31623: operation generated ORACLE error 31623
ORA-31623: a job is not attached to this session via the specified handle
ORA-06512: at "SYS.DBMS_DATAPUMP", line 3263
ORA-06512: at "SYS.DBMS_DATAPUMP", line 4488
ORA-06512: at line 1

Solution

For this Data Pump error, you will need to configure the database with some Streams Pool.

Perform the following query to find out how much STREAMS_POOL_SIZE has been allocated

 select * from v$sgainfo;
 ...
 Streams Pool Size                               0 Yes

Data Pump now uses Advanced Queuing (AQ) internally, so it can handle job stops/starts/re-starts.  
However, AQ using the Streams Pool, where the database currently has the STREAMS_POOL_SIZE set to ZERO.

Manually set the STREAMS_POOL_SIZE, re-start the database and re-attempt the Data Pump Export.

Alternately, turn on Automatic Shared Memory management (ASMM) by setting SGA_TARGET or MEMORY_TARGET.

显然上述Note在有一点上说错了,那就是设置memory_target参数无益于解决该UDE-31623问题;最好的做法还是显式地去设置streams_pool_size参数,但遗憾的是streams_pool_size虽然是一个可以动态修改的参数,但实际上是无法动态修改的:

SQL> col name for a20
SQL>
SQL> select name,isinstance_modifiable from v$system_parameter where name='streams_pool_size';

NAME                 ISINS
-------------------- -----
streams_pool_size    TRUE

SQL> alter system set streams_pool_size=60M sid='PROD1';
alter system set streams_pool_size=60M sid='PROD1'
*
ERROR at line 1:
ORA-02097: parameter cannot be modified because specified value is invalid
ORA-04033: Insufficient memory to grow pool

SQL> alter system set streams_pool_size=60M sid='PROD1' scope=spfile;
System altered.

Restart Instance .................

[oracle@rh2 dbs]$ expdp system/password dumpfile=s01:sh1.dmp schemas=sh

Export: Release 11.2.0.2.0 - Production on Mon May 2 23:28:33 2011

Copyright (c) 1982, 2009, Oracle and/or its affiliates.  All rights reserved.

Connected to: Oracle Database 11g Enterprise Edition Release 11.2.0.2.0 - 64bit Production
With the Partitioning, Real Application Clusters, Automatic Storage Management, OLAP,
Data Mining and Real Application Testing options
Starting "SYSTEM"."SYS_EXPORT_SCHEMA_01":  system/******** dumpfile=s01:sh1.dmp schemas=sh
Estimate in progress using BLOCKS method...
Processing object type SCHEMA_EXPORT/TABLE/TABLE_DATA
Total estimation using BLOCKS method: 273.8 MB
Processing object type SCHEMA_EXPORT/USER
Processing object type SCHEMA_EXPORT/SYSTEM_GRANT
Processing object type SCHEMA_EXPORT/ROLE_GRANT
Processing object type SCHEMA_EXPORT/DEFAULT_ROLE
Processing object type SCHEMA_EXPORT/PRE_SCHEMA/PROCACT_SCHEMA
Processing object type SCHEMA_EXPORT/TABLE/TABLE
Processing object type SCHEMA_EXPORT/TABLE/GRANT/OWNER_GRANT/OBJECT_GRANT
Processing object type SCHEMA_EXPORT/TABLE/INDEX/INDEX
Processing object type SCHEMA_EXPORT/TABLE/CONSTRAINT/CONSTRAINT
Processing object type SCHEMA_EXPORT/TABLE/INDEX/STATISTICS/INDEX_STATISTICS
Processing object type SCHEMA_EXPORT/TABLE/COMMENT
Processing object type SCHEMA_EXPORT/VIEW/VIEW
Processing object type SCHEMA_EXPORT/TABLE/CONSTRAINT/REF_CONSTRAINT
Processing object type SCHEMA_EXPORT/TABLE/INDEX/FUNCTIONAL_AND_BITMAP/INDEX
Processing object type SCHEMA_EXPORT/TABLE/INDEX/STATISTICS/FUNCTIONAL_AND_BITMAP/INDEX_STATISTICS
Processing object type SCHEMA_EXPORT/TABLE/STATISTICS/TABLE_STATISTICS
Processing object type SCHEMA_EXPORT/TABLE/INDEX/DOMAIN_INDEX/INDEX
Processing object type SCHEMA_EXPORT/MATERIALIZED_VIEW
Processing object type SCHEMA_EXPORT/DIMENSION
. . exported "SH"."CUSTOMERS"                            9.853 MB   55500 rows
. . exported "SH"."COSTS":"COSTS_Q1_1998"                139.5 KB    4411 rows
. . exported "SH"."COSTS":"COSTS_Q1_1999"                183.5 KB    5884 rows
. . exported "SH"."COSTS":"COSTS_Q1_2000"                120.6 KB    3772 rows
. . exported "SH"."COSTS":"COSTS_Q1_2001"                227.8 KB    7328 rows
. . exported "SH"."COSTS":"COSTS_Q2_1998"                79.52 KB    2397 rows
. . exported "SH"."COSTS":"COSTS_Q2_1999"                132.5 KB    4179 rows
. . exported "SH"."COSTS":"COSTS_Q2_2000"                119.0 KB    3715 rows
. . exported "SH"."COSTS":"COSTS_Q2_2001"                184.5 KB    5882 rows
. . exported "SH"."COSTS":"COSTS_Q3_1998"                131.1 KB    4129 rows
. . exported "SH"."COSTS":"COSTS_Q3_1999"                137.3 KB    4336 rows
. . exported "SH"."COSTS":"COSTS_Q3_2000"                151.4 KB    4798 rows
. . exported "SH"."COSTS":"COSTS_Q3_2001"                234.4 KB    7545 rows
. . exported "SH"."COSTS":"COSTS_Q4_1998"                144.7 KB    4577 rows
. . exported "SH"."COSTS":"COSTS_Q4_1999"                159.0 KB    5060 rows
. . exported "SH"."COSTS":"COSTS_Q4_2000"                160.2 KB    5088 rows
. . exported "SH"."COSTS":"COSTS_Q4_2001"                278.4 KB    9011 rows
. . exported "SH"."SALES":"SALES_Q1_1998"                1.412 MB   43687 rows
. . exported "SH"."SALES":"SALES_Q1_1999"                2.071 MB   64186 rows
. . exported "SH"."SALES":"SALES_Q1_2000"                2.012 MB   62197 rows
. . exported "SH"."SALES":"SALES_Q1_2001"                1.965 MB   60608 rows
. . exported "SH"."SALES":"SALES_Q2_1998"                1.160 MB   35758 rows
. . exported "SH"."SALES":"SALES_Q2_1999"                1.754 MB   54233 rows
. . exported "SH"."SALES":"SALES_Q2_2000"                1.802 MB   55515 rows
. . exported "SH"."SALES":"SALES_Q2_2001"                2.051 MB   63292 rows
. . exported "SH"."SALES":"SALES_Q3_1998"                1.633 MB   50515 rows
. . exported "SH"."SALES":"SALES_Q3_1999"                2.166 MB   67138 rows
. . exported "SH"."SALES":"SALES_Q3_2000"                1.909 MB   58950 rows
. . exported "SH"."SALES":"SALES_Q3_2001"                2.130 MB   65769 rows
. . exported "SH"."SALES":"SALES_Q4_1998"                1.581 MB   48874 rows
. . exported "SH"."SALES":"SALES_Q4_1999"                2.014 MB   62388 rows
. . exported "SH"."SALES":"SALES_Q4_2000"                1.814 MB   55984 rows
. . exported "SH"."SALES":"SALES_Q4_2001"                2.257 MB   69749 rows
. . exported "SH"."SUPPLEMENTARY_DEMOGRAPHICS"           697.3 KB    4500 rows
. . exported "SH"."FWEEK_PSCAT_SALES_MV"                 419.8 KB   11266 rows
. . exported "SH"."PROMOTIONS"                           58.89 KB     503 rows
. . exported "SH"."TIMES"                                380.8 KB    1826 rows
. . exported "SH"."CAL_MONTH_SALES_MV"                   6.312 KB      48 rows
. . exported "SH"."CHANNELS"                              7.25 KB       5 rows
. . exported "SH"."COUNTRIES"                            10.20 KB      23 rows
. . exported "SH"."PRODUCTS"                             26.17 KB      72 rows
. . exported "SH"."COSTS":"COSTS_1995"                       0 KB       0 rows
. . exported "SH"."COSTS":"COSTS_1996"                       0 KB       0 rows
. . exported "SH"."COSTS":"COSTS_H1_1997"                    0 KB       0 rows
. . exported "SH"."COSTS":"COSTS_H2_1997"                    0 KB       0 rows
. . exported "SH"."COSTS":"COSTS_Q1_2002"                    0 KB       0 rows
. . exported "SH"."COSTS":"COSTS_Q1_2003"                    0 KB       0 rows
. . exported "SH"."COSTS":"COSTS_Q2_2002"                    0 KB       0 rows
. . exported "SH"."COSTS":"COSTS_Q2_2003"                    0 KB       0 rows
. . exported "SH"."COSTS":"COSTS_Q3_2002"                    0 KB       0 rows
. . exported "SH"."COSTS":"COSTS_Q3_2003"                    0 KB       0 rows
. . exported "SH"."COSTS":"COSTS_Q4_2002"                    0 KB       0 rows
. . exported "SH"."COSTS":"COSTS_Q4_2003"                    0 KB       0 rows
. . exported "SH"."DIMENSION_EXCEPTIONS"                     0 KB       0 rows
. . exported "SH"."SALES":"SALES_1995"                       0 KB       0 rows
. . exported "SH"."SALES":"SALES_1996"                       0 KB       0 rows
. . exported "SH"."SALES":"SALES_H1_1997"                    0 KB       0 rows
. . exported "SH"."SALES":"SALES_H2_1997"                    0 KB       0 rows
. . exported "SH"."SALES":"SALES_Q1_2002"                    0 KB       0 rows
. . exported "SH"."SALES":"SALES_Q1_2003"                    0 KB       0 rows
. . exported "SH"."SALES":"SALES_Q2_2002"                    0 KB       0 rows
. . exported "SH"."SALES":"SALES_Q2_2003"                    0 KB       0 rows
. . exported "SH"."SALES":"SALES_Q3_2002"                    0 KB       0 rows
. . exported "SH"."SALES":"SALES_Q3_2003"                    0 KB       0 rows
. . exported "SH"."SALES":"SALES_Q4_2002"                    0 KB       0 rows
. . exported "SH"."SALES":"SALES_Q4_2003"                    0 KB       0 rows
Master table "SYSTEM"."SYS_EXPORT_SCHEMA_01" successfully loaded/unloaded
******************************************************************************
Dump file set for SYSTEM.SYS_EXPORT_SCHEMA_01 is:
  /s01/sh1.dmp
Job "SYSTEM"."SYS_EXPORT_SCHEMA_01" successfully completed at 23:30:20

/* 11g中加强了data pump在告警日志中的记录信息,可以看到这里成功启动了DM进程*/

DM00 started with pid=55, OS id=25347, job SYSTEM.SYS_EXPORT_SCHEMA_01
2011-05-02 23:28:35.814000 +08:00
Starting background process SMCO
SMCO started with pid=56, OS id=25349
DW00 started with pid=57, OS id=25351, wid=1, job SYSTEM.SYS_EXPORT_SCHEMA_01
2011-05-02 23:28:54.029000 +08:00
XDB installed.
XDB initialized.

解决ORA-27103:internal error错误一例

一套Linux x86-64上的11.2.0.2数据库在startup启动阶段遭遇了ORA-27103:internal error内部错误,其出错日志如下:

SQL> startup nomount;
ORA-27103: internal error
Linux-x86_64 Error: 2: No such file or directory
Additional information: 9404423
Additional information: 2

oerr 27103
Usage: oerr facility error

Facility is identified by the prefix string in the error message.
For example, if you get ORA-7300, "ora" is the facility and "7300"
is the error.  So you should type "oerr ora 7300".

If you get LCD-111, type "oerr lcd 111", and so on.

================= alert.log ====================
This instance was first to mount
2011-05-02 21:49:47.009000 +08:00
Use ADRCI or Support Workbench to package the incident.
See Note 411.1 at My Oracle Support for error and packaging details.
Errors in file /s01/orabase/diag/rdbms/prod/PROD1/trace/PROD1_asmb_14386.trc:
ORA-04031: unable to allocate 393240 bytes of shared memory 
("large pool","unknown object","large pool","ASM map operations hashtable")
ASMB (ospid: 14386): terminating the instance due to error 4031

System state dump requested by (instance=1, osid=14386 (ASMB)), summary=[abnormal instance termination].

System State dumped to trace file /s01/orabase/diag/rdbms/prod/PROD1/trace/PROD1_diag_14346.trc

Dumping diagnostic data in directory=[cdmp_20110502214947], requested by 
(instance=1, osid=14386 (ASMB)), summary=[abnormal instance termination].

Instance terminated by ASMB, pid = 14386

=============================system state dump============================

PROCESS 24: ASMB
  ----------------------------------------
  SO: 0x92c955c8, type: 2, owner: (nil), flag: INIT/-/-/0x00 if: 0x3 c: 0x3
   proc=0x92c955c8, name=process, file=ksu.h LINE:12451, pg=0
  (process) Oracle pid:24, ser:1, calls cur/top: 0x9288c778/0x9288c778
            flags : (0x6) SYSTEM
            flags2: (0x0),  flags3: (0x0)
            intr error: 0, call error: 0, sess error: 0, txn error 0
            intr queue: empty
    ksudlp FALSE at location: 0
  (post info) last post received: 2296 0 2
              last post received-location: ksl2.h LINE:2293 ID:kslpsr
              last process to post me: 92c8e248 1 6
              last post sent: 0 0 26
              last post sent-location: ksa2.h LINE:282 ID:ksasnd
              last process posted by me: 92c8e248 1 6
    (latch info) wait_event=0 bits=0
    Process Group: DEFAULT, pseudo proc: 0x92d24ae0
    O/S info: user: oracle, term: UNKNOWN, ospid: 14386
    OSD pid info: Unix process pid: 14386, image: oracle@rh2.oracle.com (ASMB)
    ----------------------------------------
    SO: 0x92e80a58, type: 4, owner: 0x92c955c8, flag: INIT/-/-/0x00 if: 0x3 c: 0x3
     proc=0x92c955c8, name=session, file=ksu.h LINE:12459, pg=0
    (session) sid: 13 ser: 1 trans: (nil), creator: 0x92c955c8
              flags: (0x51) USR/- flags_idl: (0x1) BSY/-/-/-/-/-
              flags2: (0x408) -/-
              DID: , short-term DID:
              txn branch: (nil)
              oct: 0, prv: 0, sql: (nil), psql: (nil), user: 0/SYS
    ksuxds FALSE at location: 0
    service name: SYS$BACKGROUND
    Current Wait Stack:
      Not in wait; last wait ended 1.501399 sec ago
    Wait State:
      fixed_waits=0 flags=0x21 boundary=(nil)/-1
    Session Wait History:
        elapsed time of 1.501469 sec since last wait
     0: waited for 'SGA: allocation forcing component growth'
        =0x0, =0x0, =0x0
        wait_id=14 seq_num=27 snap_id=7
        wait times: snap=0.000000 sec, exc=0.305374 sec, total=0.305390 sec
        wait times: max=infinite
        wait counts: calls=6 os=6
        occurred after 0.000000 sec of elapsed time
     1: waited for 'SGA: allocation forcing component growth'
        =0x0, =0x0, =0x0
        wait_id=20 seq_num=26 snap_id=1
        wait times: snap=0.000001 sec, exc=0.000001 sec, total=0.000001 sec
        wait times: max=infinite
        wait counts: calls=1 os=1
        occurred after 0.000000 sec of elapsed time
     2: waited for 'SGA: allocation forcing component growth'
        =0x0, =0x0, =0x0
        wait_id=14 seq_num=25 snap_id=6

在没有阅读告警日志前我的第一反应可能是上次shutdown时Oracle进程没有被清理干净,导致shared memory segments一直没有释放,从而造成了以上ORA-27103错误。

不过其实这个问题告警日志里有明确的信息,即RDBMS Instance数据库实例在mount阶段asmb进程(负责db instance与asm instance的交互)试图从large pool大池中分配390k的空间,但遭遇了ORA-04031错误,如果asmb后台进程无法正常工作将直接导致db实例无法找到asm存储上的必要Extent,因此导致出出现了”ORA-27103: internal error:Linux-x86_64 Error: 2: No such file or directory”。

换而言之ORA-04031错误才是罪魁祸首,我们来是看该实例初始化的内存参数:

[oracle@rh2 dbs]$ strings spfilePROD1.ora |egrep "sga|memory|pool"
PROD1.__large_pool_size=16777216
*.memory_target=943718400
*.shared_pool_size=314572800
*.streams_pool_size=0

因为是11g的实例所以采用了automatic memory management特性管理直接设置了memory_target参数为900M,并设置了1号实例的large pool最小为16M,900M的大小对于10g的实例而言仍是绰绰有余的,但是显然在11gr2中设置memory_target为900M是不足以驱动这样一个”庞然大物”的。我们需要配置更多的内存,亦或者可以通过设置更大的large pool来解决令人郁闷的ORA-04031错误:

[oracle@rh2 dbs]$ strings spfilePROD1.ora > initPROD1.ora
[oracle@rh2 dbs]$ rm spfilePROD1.ora 
[oracle@rh2 dbs]$ vi initPROD1.ora

/* 修改memory_target为至少912M */

*.memory_target=1200M

/* 成功启动!  */
SQL> startup ;
ORACLE instance started.

Total System Global Area 1252663296 bytes
Fixed Size                  2226072 bytes
Variable Size             687868008 bytes
Database Buffers          553648128 bytes
Redo Buffers                8921088 bytes
Database mounted.
Database opened.

Private Interface 'eth1:1' configured from GPnP for use as a private interconnect.
  [name='eth1:1', type=1, ip=169.254.236.169, mac=94-0c-6d-71-8c-c2, net=169.254.0.0/16, mask=255.255.0.0, use=haip:cluster_interconnect/62]
Public Interface 'eth0' configured from GPnP for use as a public interface.
  [name='eth0', type=1, ip=192.168.1.121, mac=6c-f0-49-03-5f-99, net=192.168.1.0/24, mask=255.255.255.0, use=public/1]
Public Interface 'eth0:1' configured from GPnP for use as a public interface.
  [name='eth0:1', type=1, ip=192.168.1.133, mac=6c-f0-49-03-5f-99, net=192.168.1.0/24, mask=255.255.255.0, use=public/1]
Public Interface 'eth0:2' configured from GPnP for use as a public interface.
  [name='eth0:2', type=1, ip=192.168.1.122, mac=6c-f0-49-03-5f-99, net=192.168.1.0/24, mask=255.255.255.0, use=public/1]
Picked latch-free SCN scheme 3
2011-05-02 22:28:04.408000 +08:00
WARNING: db_recovery_file_dest is same as db_create_file_dest
Autotune of undo retention is turned on. 
LICENSE_MAX_USERS = 0
SYS auditing is disabled
Starting up:
Oracle Database 11g Enterprise Edition Release 11.2.0.2.0 - 64bit Production
With the Partitioning, Real Application Clusters, OLAP, Data Mining
and Real Application Testing options.
Using parameter settings in server-side pfile /s01/oracle/product/11.2.0/dbhome_1/dbs/initPROD1.ora
System parameters with non-default values:
  processes                = 150
  shared_pool_size         = 304M
  streams_pool_size        = 0
  memory_target            = 1200M
  control_files            = "+DATA/prod/controlfile/current.261.747100215"
  control_files            = "+DATA/prod/controlfile/current.260.747100215"
  db_block_size            = 8192
  db_flash_cache_file      = "/flashcard/prod1cache.dsk"
  db_flash_cache_size      = 20G
  compatible               = "11.2.0.0.0"
  log_archive_dest_1       = "location=+DATA"
  cluster_database         = TRUE
  db_create_file_dest      = "+DATA"
  db_recovery_file_dest    = "+DATA"
  db_recovery_file_dest_size= 40320M
  thread                   = 1
  undo_tablespace          = "UNDOTBS1"
  instance_number          = 1
  db_domain                = ""
  dispatchers              = "(PROTOCOL=TCP) (SERVICE=PRODXDB)"
  remote_listener          = "rh-cluster-scan:1521"
  remote_listener          = "*.remote_login_pas"
  audit_file_dest          = "/s01/orabase/admin/PROD/adump"
  audit_trail              = "DB"
  db_name                  = "PROD"
  open_cursors             = 300
  diagnostic_dest          = "/s01/orabase"
Cluster communication is configured to use the following interface(s) for this instance
  169.254.236.169
cluster interconnect IPC version:Oracle UDP/IP (generic)
IPC Vendor 1 proto 2
2011-05-02 22:28:07.675000 +08:00
ORA-00132: syntax error or unresolved network name '*.remote_login_pas'
PMON started with pid=2, OS id=19807 
PSP0 started with pid=3, OS id=19809 
2011-05-02 22:28:08.754000 +08:00
VKTM started with pid=4, OS id=19811 at elevated priority
GEN0 started with pid=5, OS id=19815 
VKTM running at (1)millisec precision with DBRM quantum (100)ms
DIAG started with pid=6, OS id=19817 
DBRM started with pid=7, OS id=19819 
PING started with pid=8, OS id=19821 
ACMS started with pid=9, OS id=19823 
DIA0 started with pid=10, OS id=19825 
LMON started with pid=11, OS id=19827 
LMD0 started with pid=12, OS id=19829 
LMS0 started with pid=13, OS id=19831 at elevated priority
RMS0 started with pid=14, OS id=19835 
LMHB started with pid=15, OS id=19837 
MMAN started with pid=16, OS id=19839 
* Load Monitor used for high load check 
* New Low - High Load Threshold Range = [1920 - 2560] 
LGWR started with pid=18, OS id=19843 
DBW0 started with pid=17, OS id=19841 
CKPT started with pid=19, OS id=19845 
SMON started with pid=20, OS id=19847 
RECO started with pid=21, OS id=19849 
RBAL started with pid=22, OS id=19851 
ASMB started with pid=23, OS id=19853 
MMON started with pid=24, OS id=19855 
starting up 1 dispatcher(s) for network address '(ADDRESS=(PARTIAL=YES)(PROTOCOL=TCP))'...
MMNL started with pid=25, OS id=19857 
starting up 1 shared server(s) ...
lmon registered with NM - instance number 1 (internal mem no 0)
2011-05-02 22:28:09.825000 +08:00
NOTE: initiating MARK startup 
Starting background process MARK
MARK started with pid=28, OS id=19866 
NOTE: MARK has subscribed 
Reconfiguration started (old inc 0, new inc 2)
List of instances:
 1 (myinst: 1) 
 Global Resource Directory frozen
* allocate domain 0, invalid = TRUE 
 Communication channels reestablished
 Master broadcasted resource hash value bitmaps
 Non-local Process blocks cleaned out
 LMS 0: 0 GCS shadows cancelled, 0 closed, 0 Xw survived
 Set master node info 
 Submitted all remote-enqueue requests
 Dwn-cvts replayed, VALBLKs dubious
 All grantable enqueues granted
 Post SMON to start 1st pass IR
 Submitted all GCS remote-cache requests
 Post SMON to start 1st pass IR
 Fix write in gcs resources
Reconfiguration complete
LCK0 started with pid=30, OS id=19872 
Starting background process RSMN
RSMN started with pid=31, OS id=19874 
ORACLE_BASE from environment = /s01/orabase
2011-05-02 22:28:12.112000 +08:00
ALTER DATABASE   MOUNT
This instance was first to mount
2011-05-02 22:28:13.202000 +08:00
NOTE: Loaded library: System 
ALTER SYSTEM SET 
local_listener='(DESCRIPTION=(ADDRESS_LIST=(ADDRESS=(PROTOCOL=TCP)(HOST=192.168.1.122)(PORT=1521))))' 
SCOPE=MEMORY SID='PROD1';
SUCCESS: diskgroup DATA was mounted
NOTE: dependency between database PROD and diskgroup resource ora.DATA.dg is established


/* 也可以直接增大large_pool_size来解决上述问题 */

large_pool_size=30M
memory_target=912M

/dev/shm Filled Up With Files In Format JOXSHM_EXT_xxx_SID_xxx


Oracle Server – Enterprise Edition – Version: 11.1.0.6 to 11.1.0.7 – Release: 11.1 to 11.1
Symptoms


/dev/shm is being filled up with files in the format JOXSHM_EXT_???_SID_???? and eventually causing the DB to restart. Oracle is not automatically cleaning those files.

Please note that it is OS specific whether such segments are visible on a filesystem or not, and if so where they get placed. eg: On Solaris shm_open() internally creates a file in /tmp with the prefix .SHMD and less the leading “/” from the shm_open argument whereas on Linux it creates an entry in /dev/shm

Changes
Most probably the database has not been closed cleanly.
Cause
This issue has been described in
<< Bug.6820987 >> /DEV/SHM IS NOT BEING CLEANED UP ON NODE 1
which was closed as duplicate of
Unpulished Bug.6662381 JOXSHM_EXT LEFT AFTER SHUTDOWN IMMEDIATE
which was closed as duplicate of
Unpublished Bug 9021155 APPSST GSI 11G: NATIVE PL/SQL CACHE FILES MAKES /TMP SLOW AND UNUSABLE

It has been determined by development that the cause of such issue is due to the fact that the database has not be closed cleanly at some point in time.

This has also been documented in the following documentation:
http://download.oracle.com/docs/cd/E17116_01/doc/readmes.112/e11015/toc.htm#BABBCFHJ
Solution
The shared object files are only freed up by the oracle executable if you do a normal shutdown.

They will build up if you shutdown abort or shutdown immediate.

This behaviour is NOT changed in any version – or changed by the fix for unpublished Bug 9021155.

1. Check if the one off Patch 9021155 is available on My Oracle Support for your Oracle version and platform. The fix for Bug 902115 allows you to specify a directory so that if you have more then one instance on a machine you are able to identify the shared files associated with a particular instance, so that you do not inadvertently clean up files from another running instance.

OR

2. Use one of the workarounds provided below:

a. Rebooting the server from time to time as this clears those files
OR
b. In 11.1.0.7 the “id” part of the name is the shared memory id of the shared memory for the instance.
eg: “ipcs -ma” ID column value is the “id” part of the name. This is not documented / guaranteed but does
give a way to see if a file corresponds to a running instance. For the files that you have you should first check
if the tail number matches to a valid SHM ID (as reported by ipcs -ma) .If not then the files are probably stale old copies and you can go ahead and delete those files. If so then those files are related to a currently running instance and deleting those files can lead to unpredictable results. Instead you can add the following code before you startup or after you shutdown the instance:

rm -f /dev/shm/JOXSHM_EXT_*_<instance name>_*
rm -f /dev/shm/PESHM_EXT_*_<instance name>_*

Again please note that the directories referenced above are OS specific and should be modified according to your OS. The above applies to Linux.

ORA-20001错误一例

一套11.1.0.7上的Oracle Application Object Library应用程序,在收集schema统计信息时出现了ORA-20001错误,具体错误日志如下:

SQL> exec fnd_stats.gather_schema_statistics('AP');

PL/SQL procedure successfully completed.

SQL> show error
No errors.
============================================
Concurrent request error Log
------------------------------------
**Starts**14-APR-2011 02:20:53
**Ends**14-APR-2011 04:40:43
ORA-0000: normal, successful completion
+---------------------------------------------------------------------------+
Start of log messages from FND_FILE
+---------------------------------------------------------------------------+
In GATHER_SCHEMA_STATS , schema_name= ALL percent= 10 degree = 8 internal_flag= NOBACKUP
stats on table AQ$_WF_CONTROL_P is locked 
stats on table FND_CP_GSM_IPC_AQTBL is locked 
stats on table WF_NOTIFICATION_OUT is locked 
Error #1: ERROR: While GATHER_TABLE_STATS:
object_name=AP.JE_FR_DAS_010***ORA-20001: invalid column name or 
duplicate columns/column groups/expressions in method_opt***
Error #2: ERROR: While GATHER_TABLE_STATS:
object_name=AP.JE_FR_DAS_010_NEW***ORA-20001: invalid column name or 
duplicate columns/column groups/expressions in method_opt***
Error #3: ERROR: While GATHER_TABLE_STATS:
object_name=AP.JG_ZZ_SYS_FORMATS_ALL_B***ORA-20001: invalid column name or 
duplicate columns/column groups/expressions in method_opt***
+---------------------------------------------------------------------------+
End of log messages from FND_FILE
+---------------------------------------------------------------------------+

经确认该问题由bug 7601966: GATHER SCHEMA STATS ON AP SCHEMA FAILS WITH ORA-20001: INVALID COLUMN NAME 引起,可以通过follow文档<Gather Schema Statistics fails with Ora-20001 errors after 11G database upgrade [ID 781813.1]>解决该问题。

【11g新特性】SPM SQL PLAN MANAGEMENT执行计划管理流程图

Oracle SPM SQL PLAN MANAGEMENT执行计划管理流程图如下:


Plan Baseline Capture - Automatic Plan Baseline Selection1 Plan Baseline Evolution1 SQL Management Base (SMB)

SQL> create table mac_spm tablespace users as select * from dba_objects;

Table created.

SQL> analyze table mac_spm compute statistics;

Table analyzed.

SQL>    alter session set optimizer_capture_sql_plan_baselines=true;

Session altered.

SQL> 
SQL>    select sum(object_id) from mac_spm;

SUM(OBJECT_ID)
--------------
    2911455720

SQL>    select sum(object_id) from mac_spm;

SUM(OBJECT_ID)
--------------
    2911455720

	alter session set optimizer_capture_sql_plan_baselines=false;

	SQL> alter system flush shared_pool;

System altered.

SQL> set autotrace on;
SQL>  select sum(object_id) from mac_spm;

SUM(OBJECT_ID)
--------------
    2911455720

Execution Plan
----------------------------------------------------------
Plan hash value: 874020942

------------------------------------------------------------------------------
| Id  | Operation          | Name    | Rows  | Bytes | Cost (%CPU)| Time     |
------------------------------------------------------------------------------
|   0 | SELECT STATEMENT   |         |     1 |     4 |   301   (1)| 00:00:04 |
|   1 |  SORT AGGREGATE    |         |     1 |     4 |            |          |
|   2 |   TABLE ACCESS FULL| MAC_SPM | 75535 |   295K|   301   (1)| 00:00:04 |
------------------------------------------------------------------------------

Note
-----
   - SQL plan baseline "SQL_PLAN_cjd95ftv8ct90eca706bd" used for this statement

Statistics
----------------------------------------------------------
        240  recursive calls
          0  db block gets
       1289  consistent gets
          0  physical reads
          0  redo size
        536  bytes sent via SQL*Net to client
        524  bytes received via SQL*Net from client
          2  SQL*Net roundtrips to/from client
         25  sorts (memory)
          0  sorts (disk)
          1  rows processed

SQL> create index ind_objd on mac_spm(object_id);

Index created.

oradebug setmypid		  
oradebug tracefile_name

SQL> alter system flush shared_pool;

System altered.

alter system set events 'trace[SQL_Plan_Management] disk highest';

select sum(object_id) from mac_spm;

*** 2013-04-11 09:28:49.628
SPM: statement found in SMB
SPM: planId's of plan baseline are: 3970369213
SPM: using qksan to reproduce, cost and select accepted plan, sig = 14462506969095103776
SPM: plan reproducibility round 1 (plan outline + session OFE)
SPM: using qksan to reproduce accepted plan, planId = 3970369213
SPM: planId in plan baseline = 3970369213, planId of reproduced plan = 3970369213
SPM: best cost so far = 301.13, current accepted plan cost = 301.13
SPM: re-parse to use selected accepted plan, planId = 3970369213
SPM: statement found in SMB
SPM: re-parsing to generate selected accepted plan,  planId = 3970369213
SPM: kkopmCheckSmbUpdate (enter) xscP=0x7f8e30491298, pmExCtx=0xc7463800, ciP=0xc99f7e78, dtCtx=0xbaf7c20

SQL> select  /*+ index( MAC_SPM ind_objd) */ sum(object_id) from mac_spm;

SUM(OBJECT_ID)
--------------
    2911455720

Execution Plan
----------------------------------------------------------
Plan hash value: 45369511

-----------------------------------------------------------------------------
| Id  | Operation        | Name     | Rows  | Bytes | Cost (%CPU)| Time     |
-----------------------------------------------------------------------------
|   0 | SELECT STATEMENT |          |     1 |     4 |   169   (1)| 00:00:03 |
|   1 |  SORT AGGREGATE  |          |     1 |     4 |            |          |
|   2 |   INDEX FULL SCAN| IND_OBJD | 75535 |   295K|   169   (1)| 00:00:03 |
-----------------------------------------------------------------------------

Statistics
----------------------------------------------------------
          1  recursive calls
          0  db block gets
        168  consistent gets
        168  physical reads
          0  redo size
        536  bytes sent via SQL*Net to client
        524  bytes received via SQL*Net from client
          2  SQL*Net roundtrips to/from client
          0  sorts (memory)
          0  sorts (disk)
          1  rows processed
SQL> insert into mac_spm select * from mac_spm;

75535 rows created.

SQL> commit;

Commit complete.

SQL> exec dbms_stats.gather_table_stats(user,'MAC_SPM');

PL/SQL procedure successfully completed.

SQL> alter system flush shared_pool;

System altered.

SQL> oradebug setmypid
Statement processed.
SQL> select sum(object_id) from mac_spm;

SUM(OBJECT_ID)
--------------
    5822911440

SQL> oradebug tracefile_name
/s01/diag/rdbms/prodb/PRODB/trace/PRODB_ora_11126.trc

*** 2013-04-11 09:45:24.248
SPM: statement found in SMB
SPM: planId's of plan baseline are: 3970369213
SPM: using qksan to reproduce, cost and select accepted plan, sig = 14462506969095103776
SPM: plan reproducibility round 1 (plan outline + session OFE)
SPM: using qksan to reproduce accepted plan, planId = 3970369213
SPM: planId in plan baseline = 3970369213, planId of reproduced plan = 3970369213
SPM: best cost so far = 623.28, current accepted plan cost = 623.28
SPM: re-parse to use selected accepted plan, planId = 3970369213
SPM: statement found in SMB
SPM: re-parsing to generate selected accepted plan,  planId = 3970369213
SPM: kkopmCheckSmbUpdate (enter) xscP=0x7f6066c949f8, pmExCtx=0xc8876e48, ciP=0xc86784c0, dtCtx=0xbaf7c20


qksan是负责SQL ANALYZE 的函数,如果看到 类似如下的信息 则说明 存在过 SQL ANALYZE

sql=/* SQL Analyze(168,0) */ select sum(object_id) from mac_spm
End parsing of cur#=4 sqlid=72ph25kpkkqhs
Semantic Analysis cur#=4 sqlid=72ph25kpkkqhs

沪ICP备14014813号-2

沪公网安备 31010802001379号